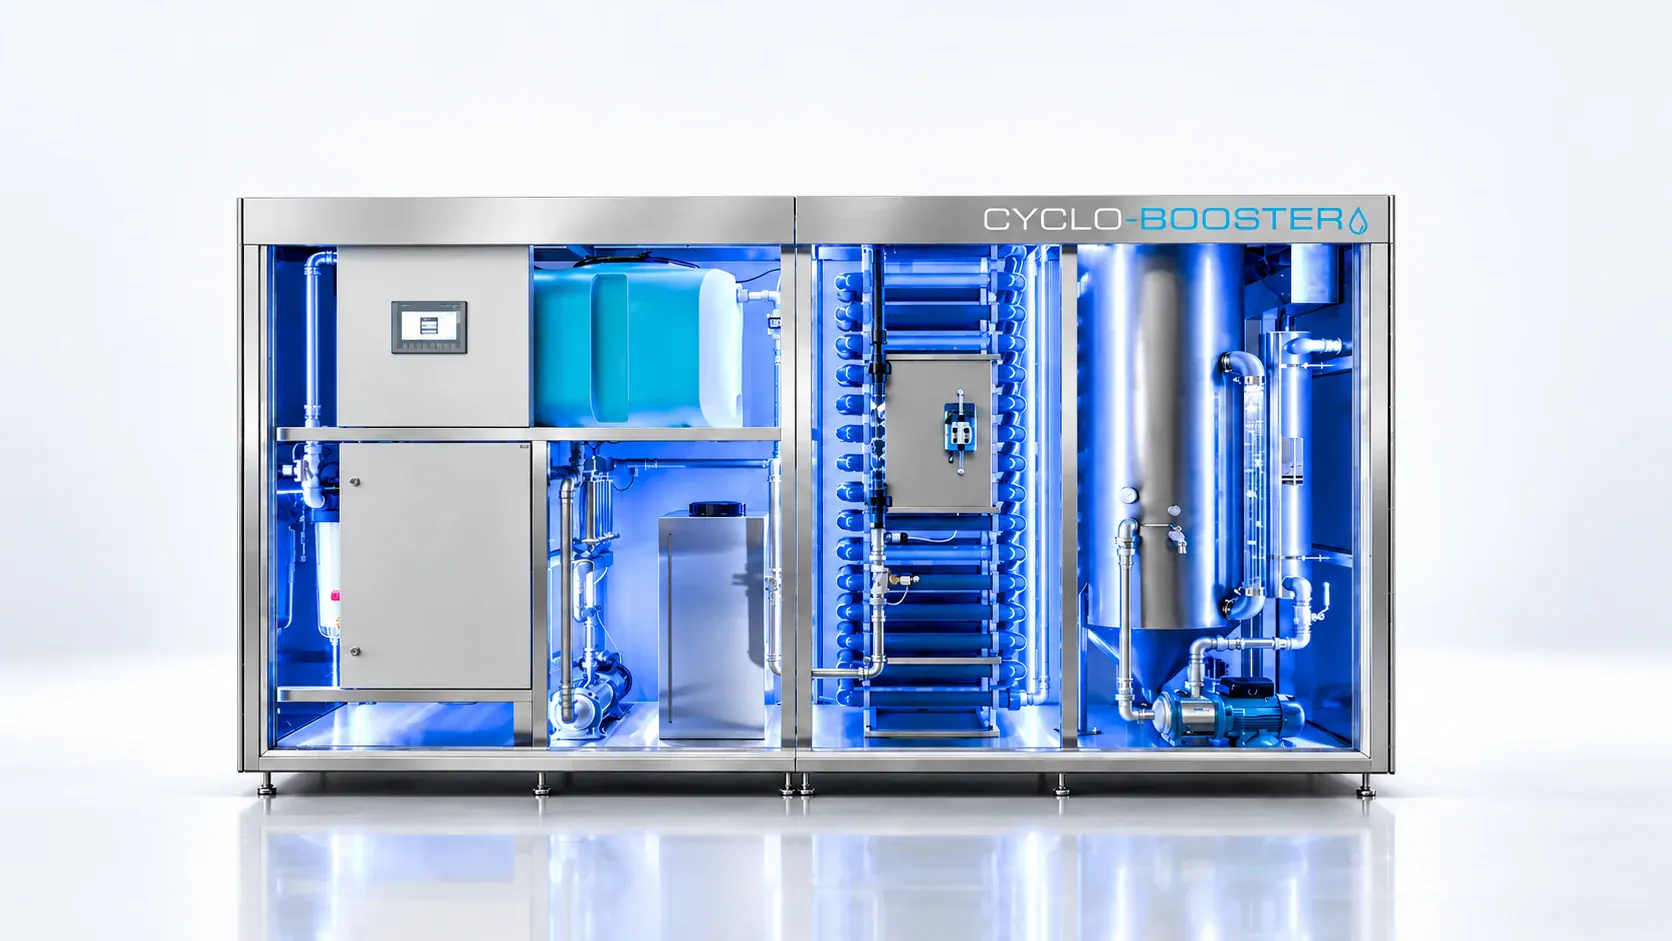
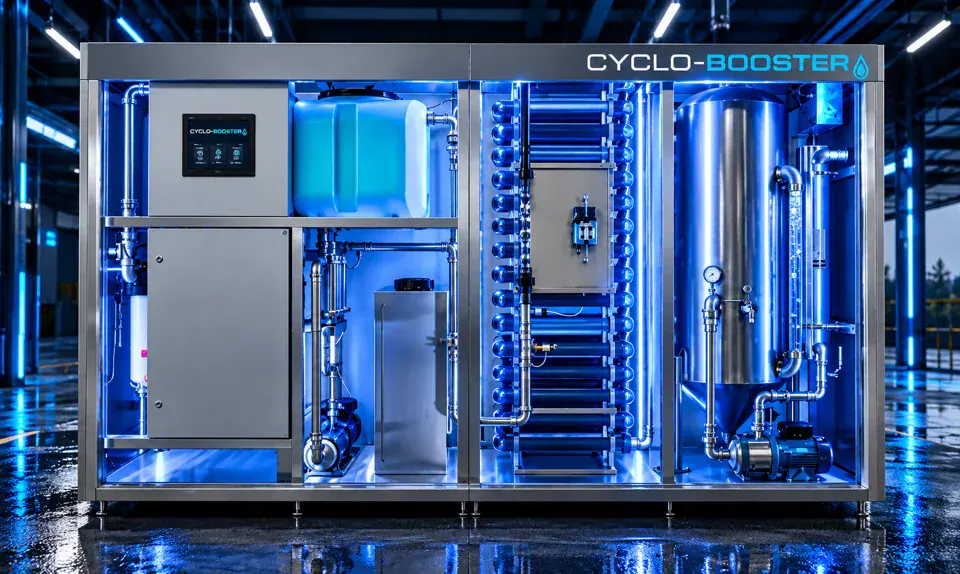
CYCLO-BOOSTER is a technology being developed by TIXE to recover water from car wash process wastewater. We are developing it to enable water reuse and more responsible resource management.
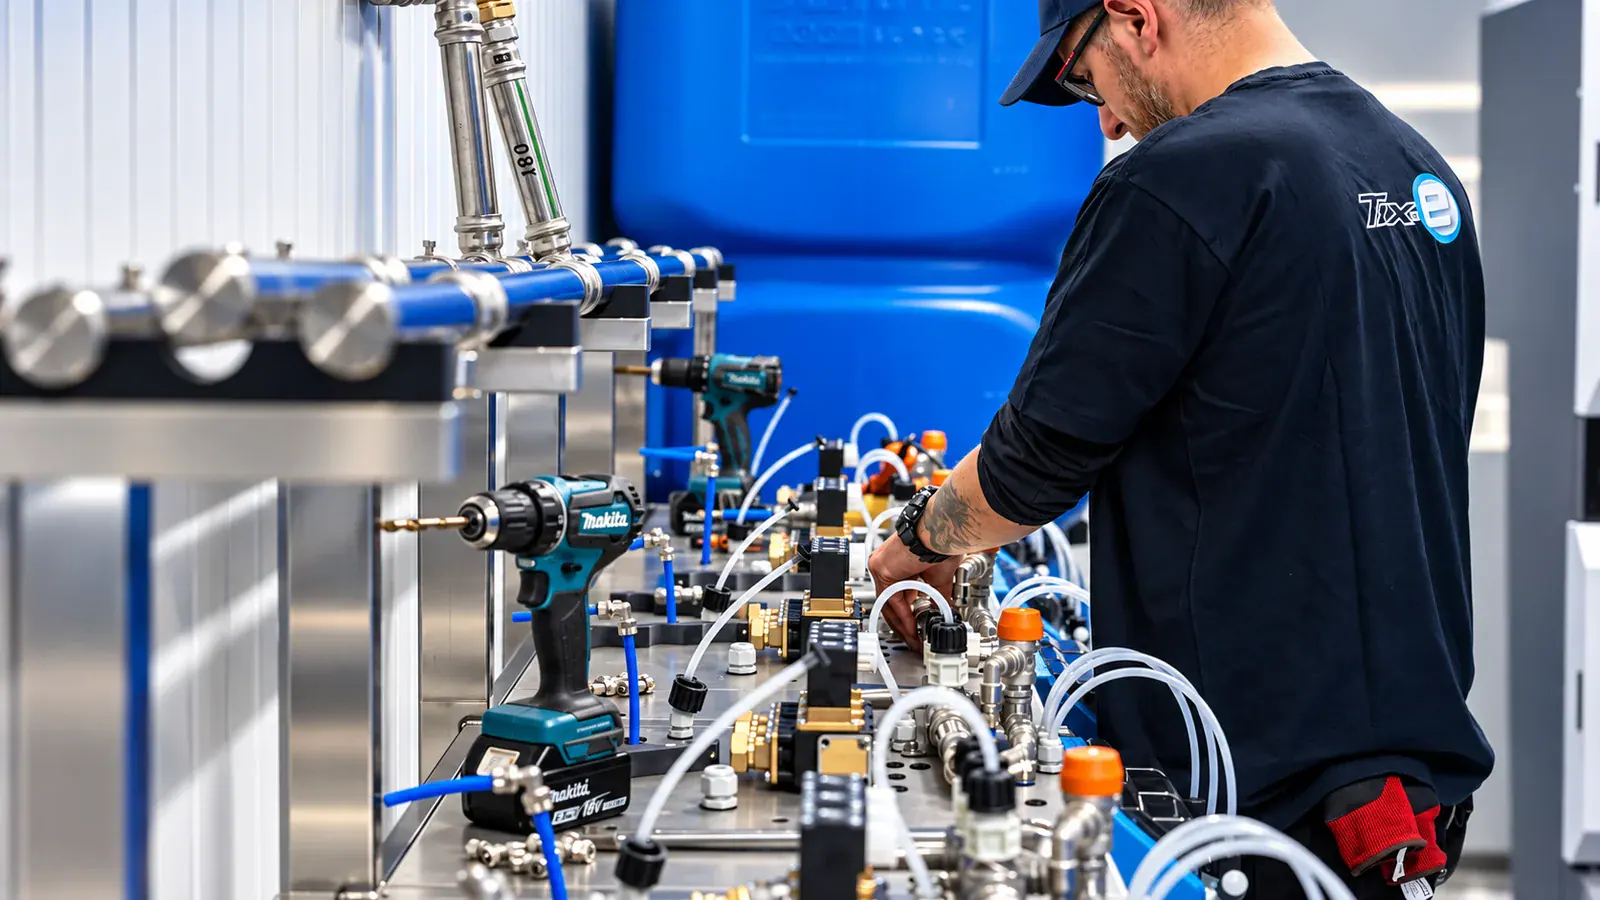
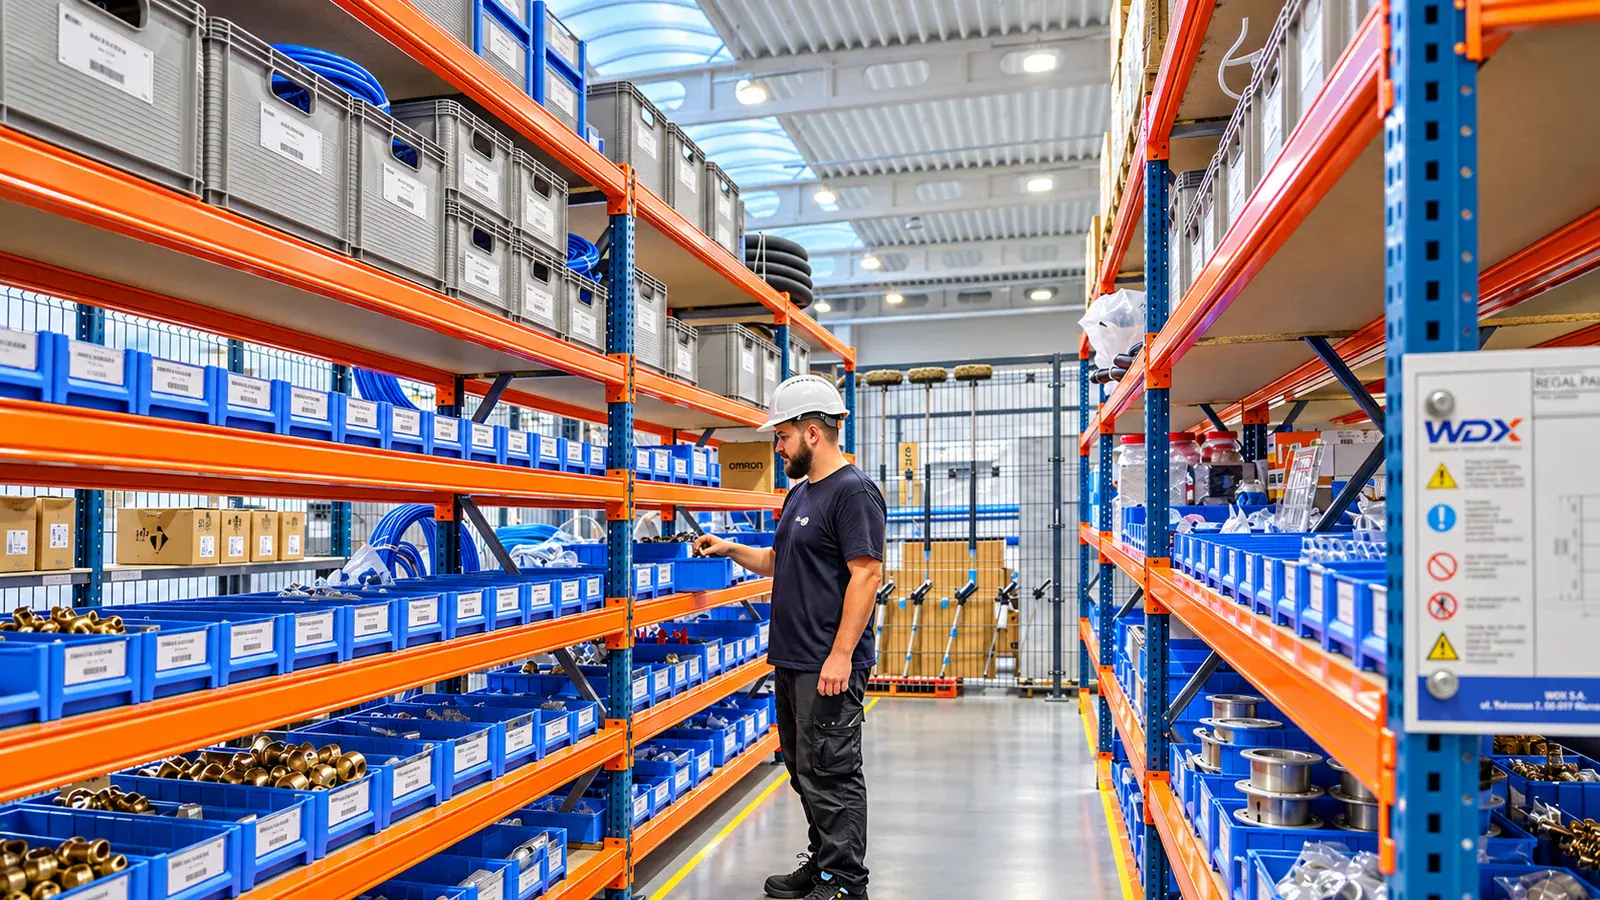
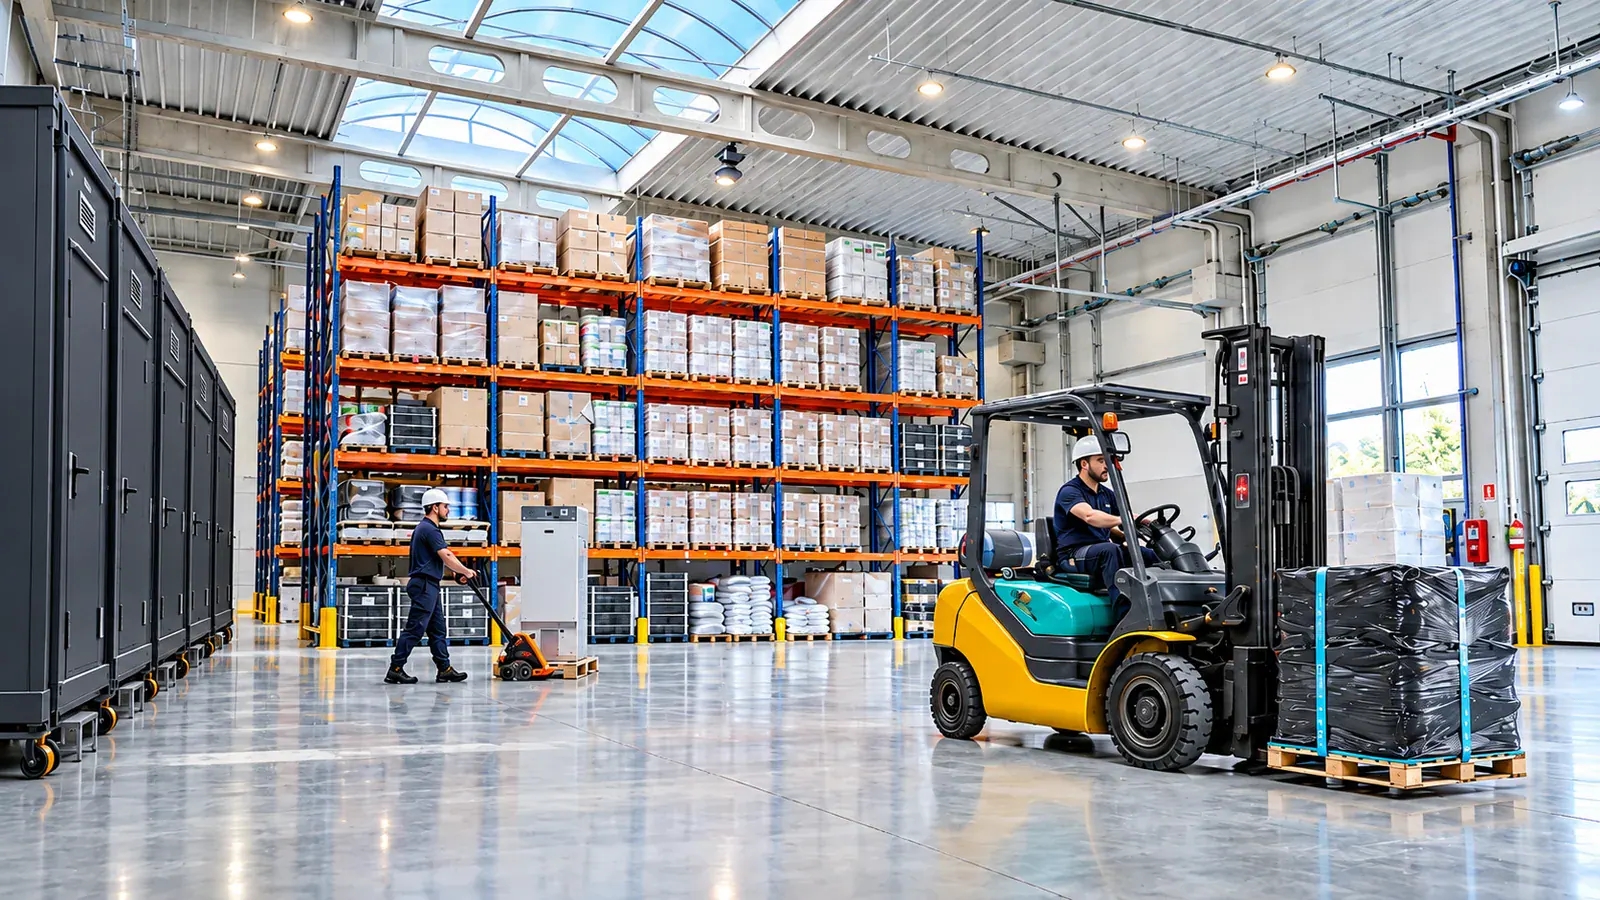
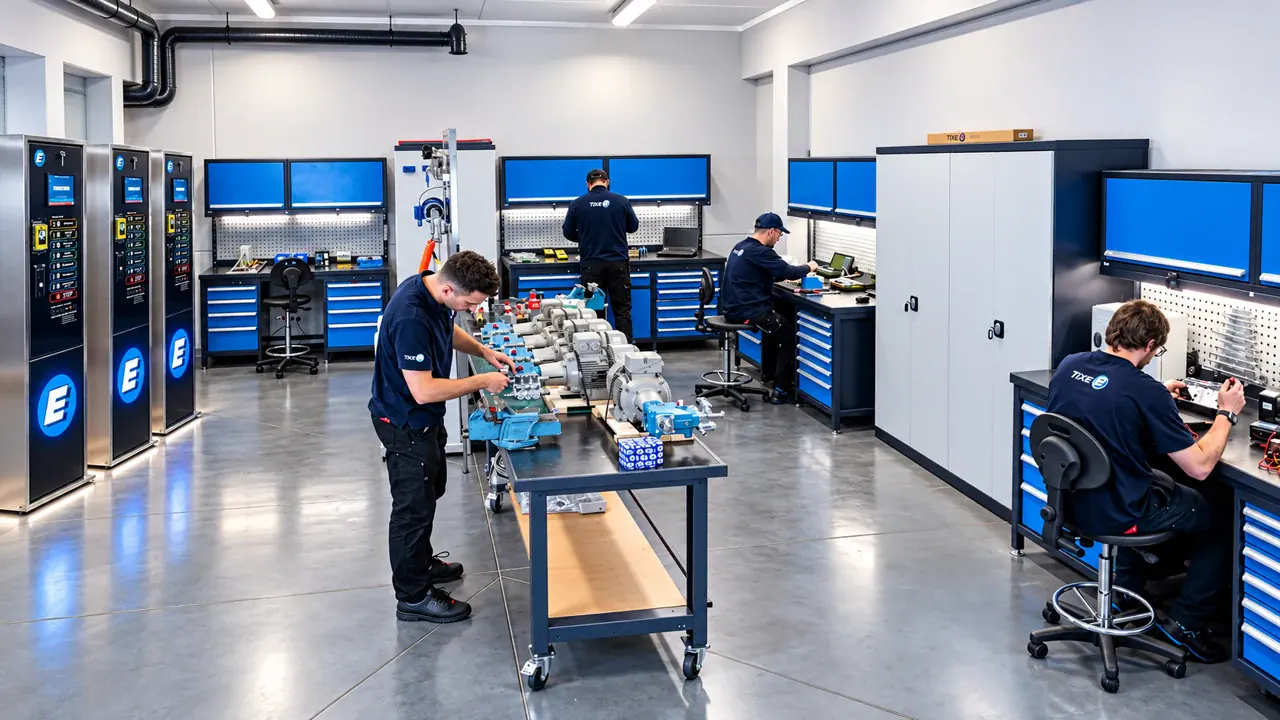
Before delivery, we check for leaks, pressure and the operation of hydraulic and electrical systems. Prefabrication allows car wash components to be prepared at the factory and makes on-site assembly more efficient.
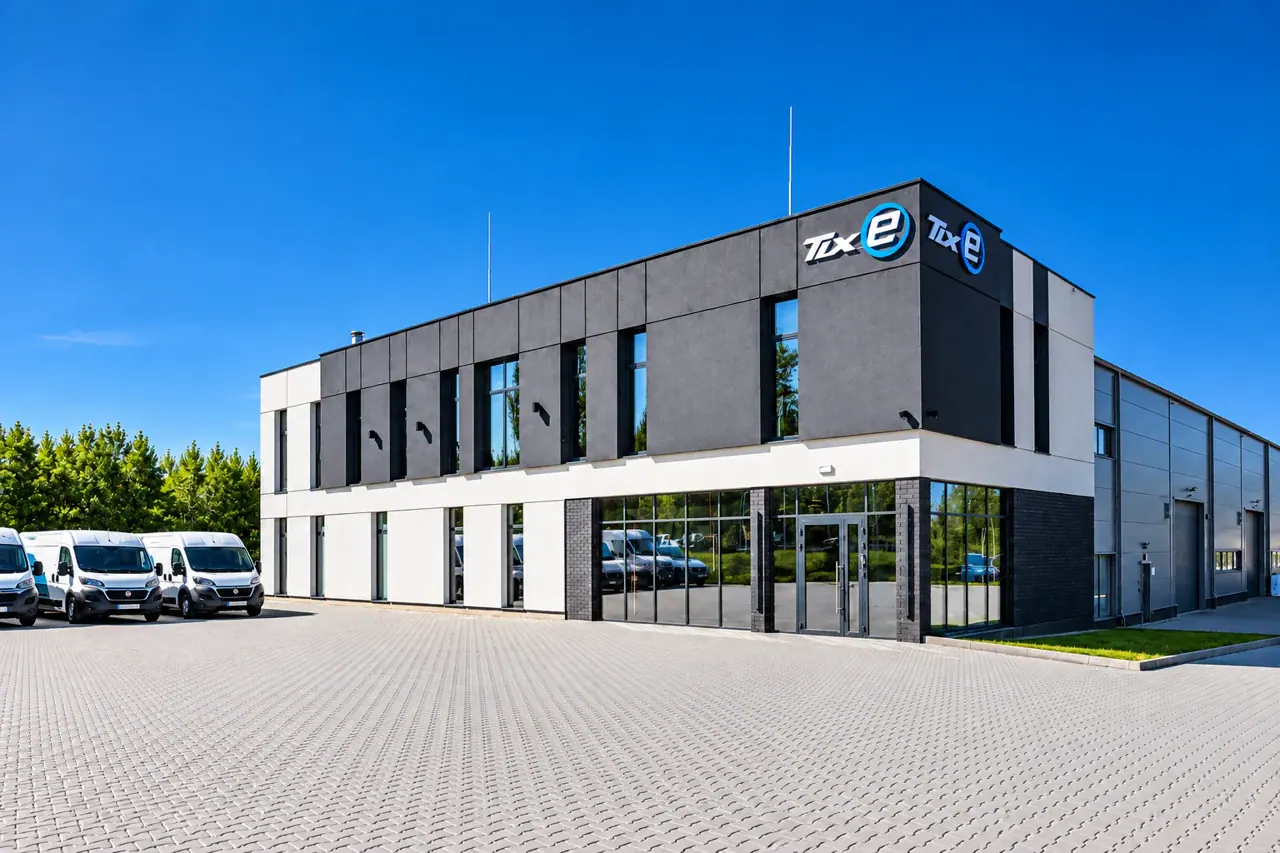
TIXE · headquarters and manufacturing facility ul. Legionów 212, 43-502 Czechowice-DziedziceAbout TIXE ↗
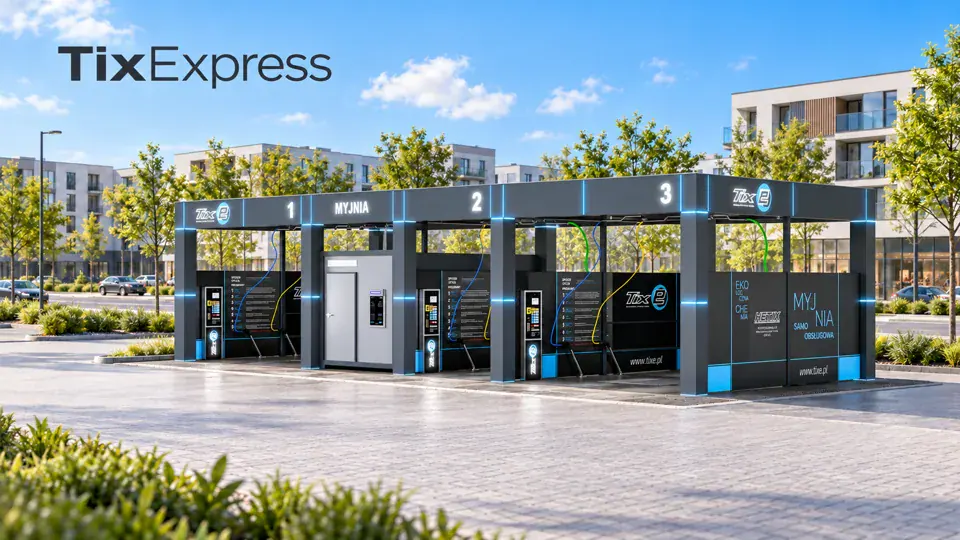
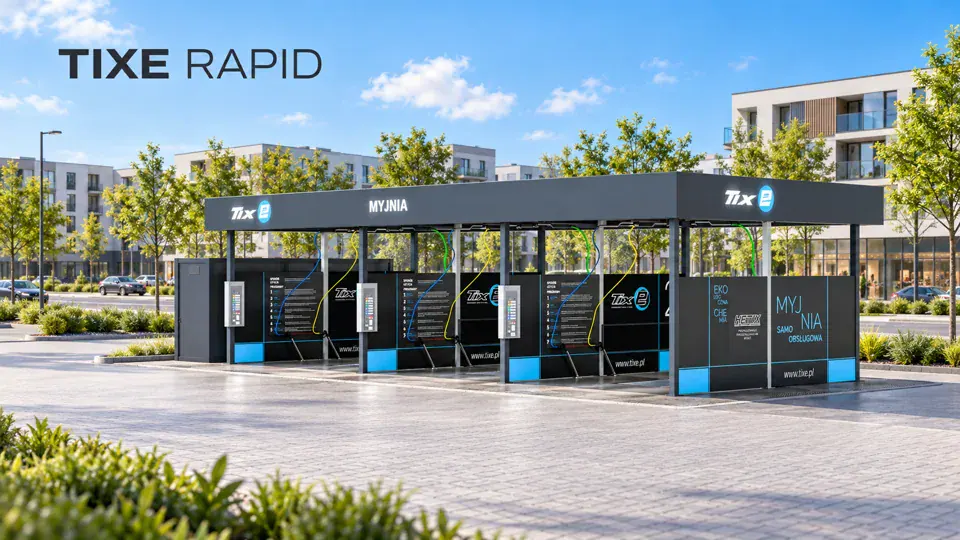
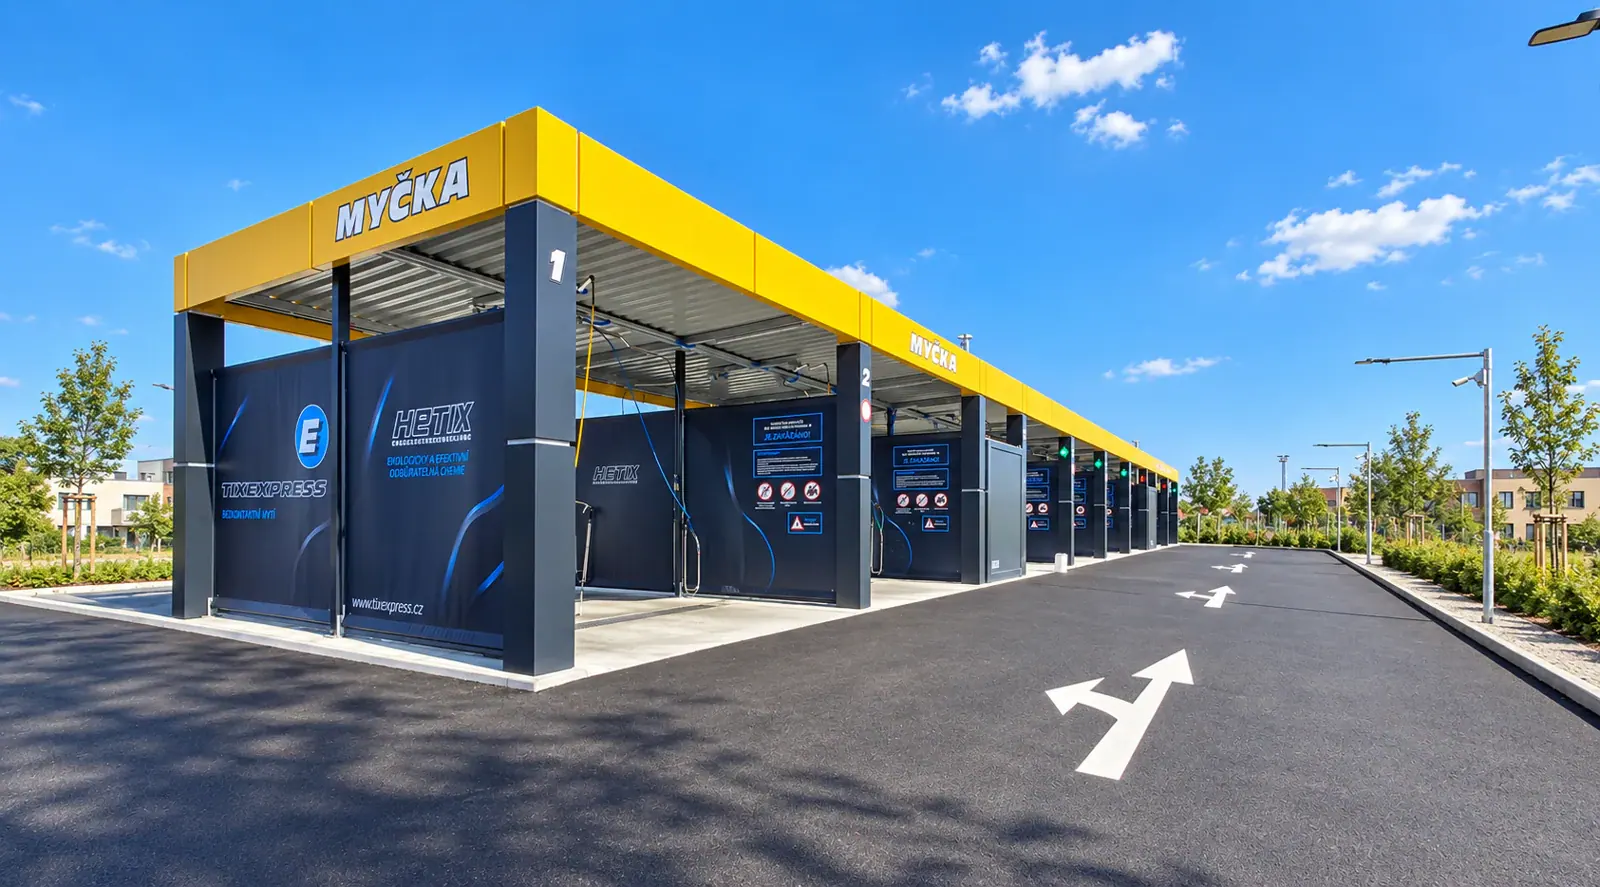
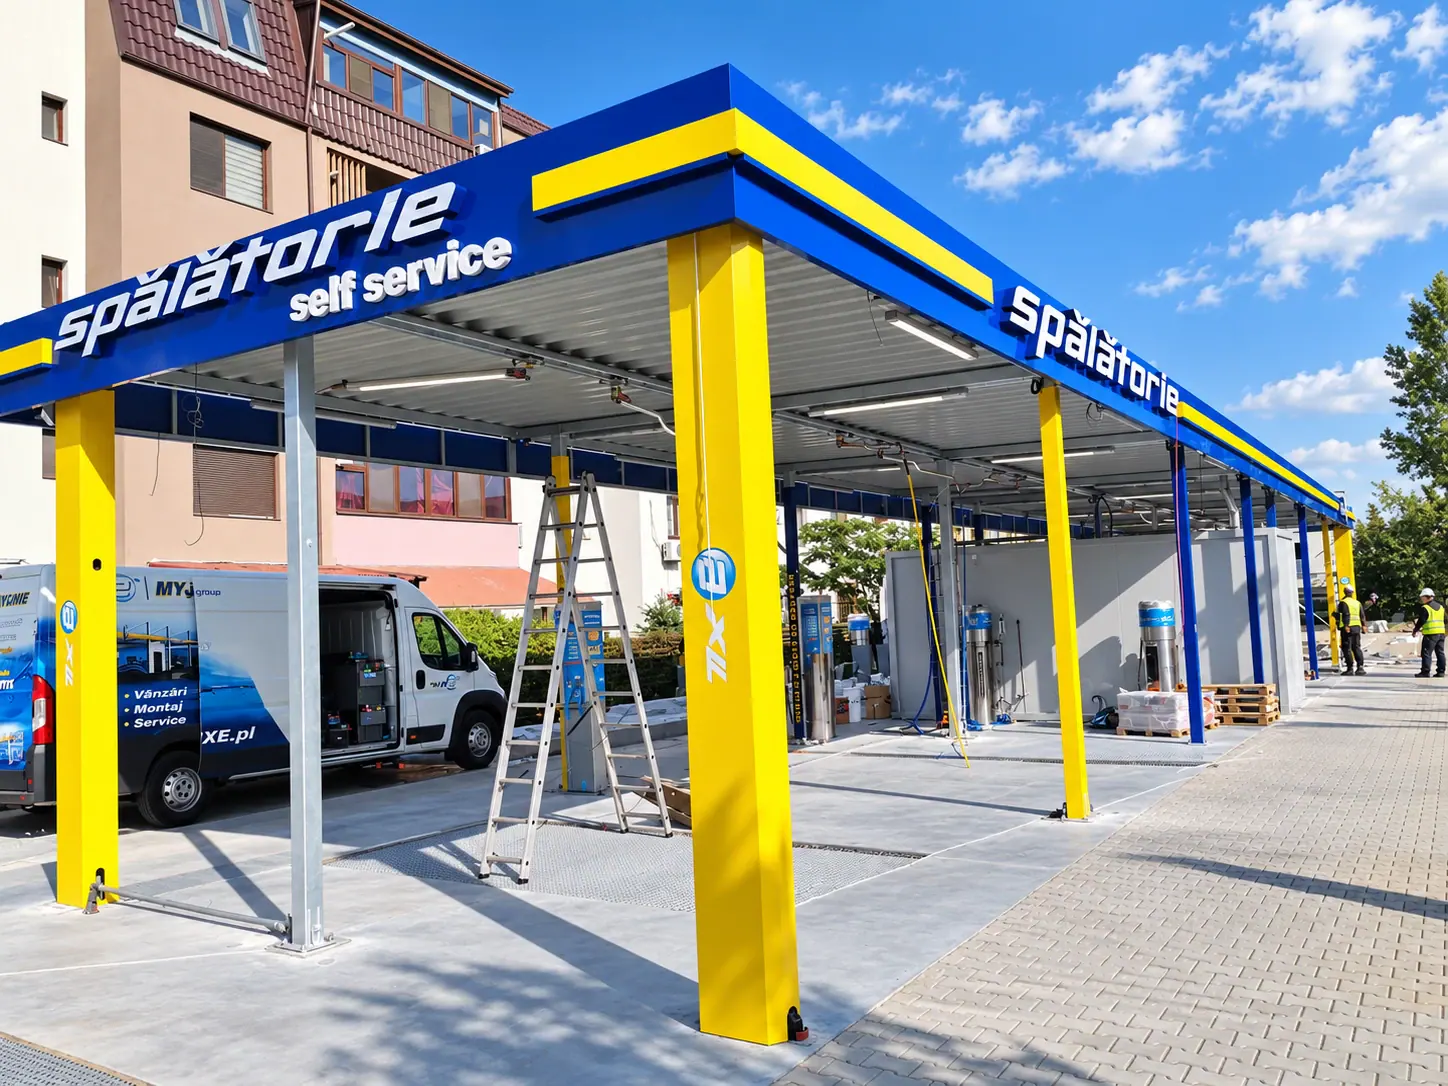
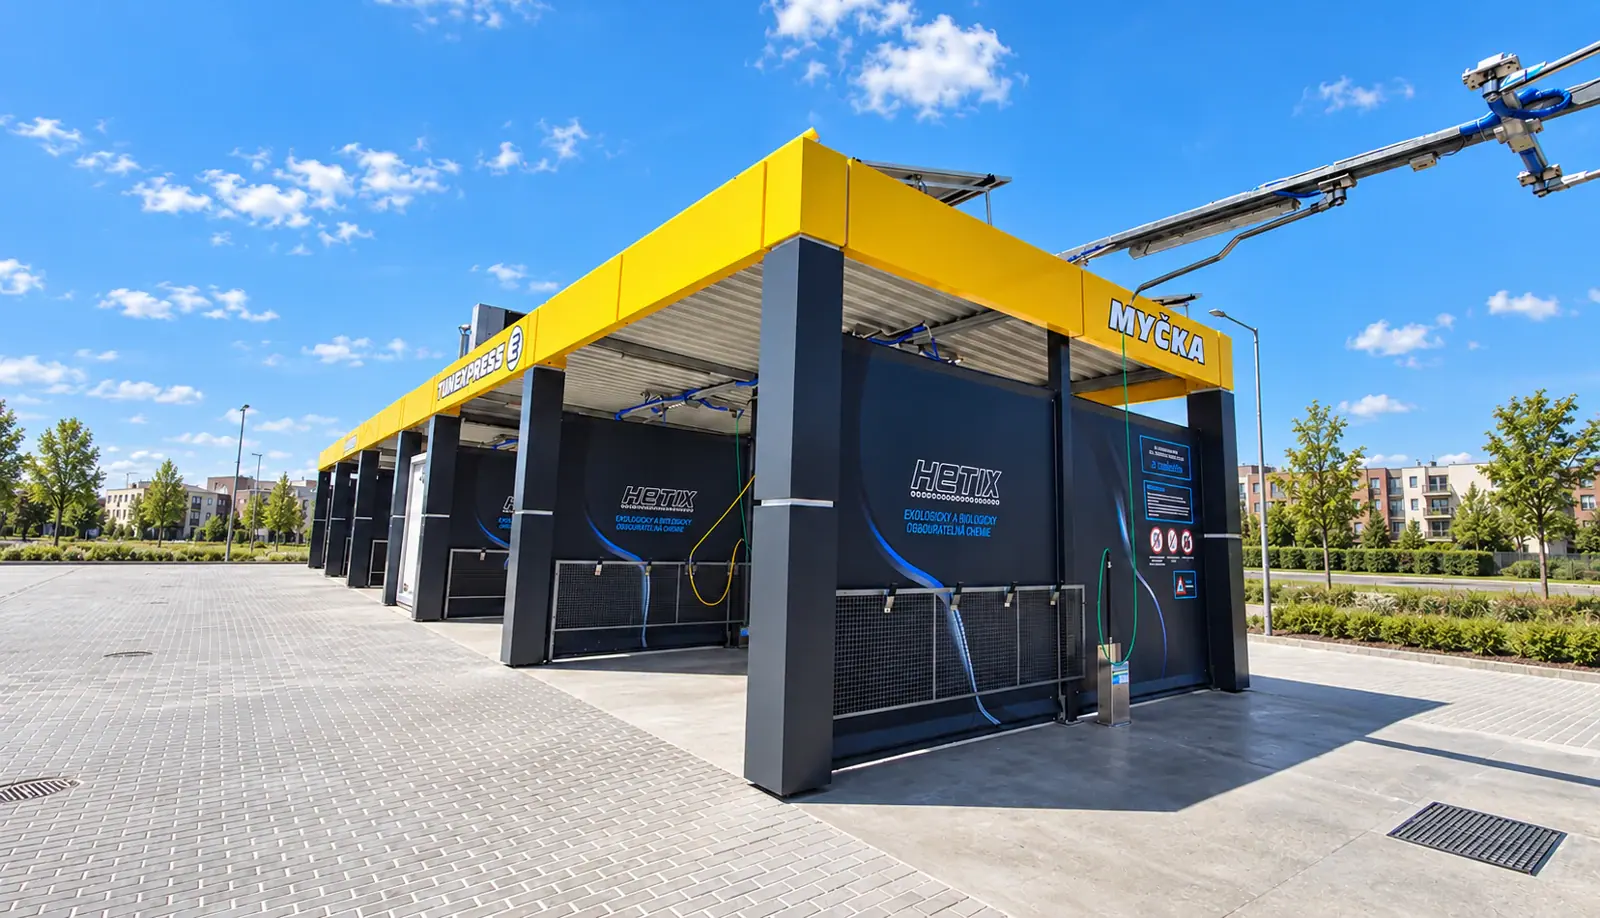
TixExpress and TixeRapid are two lines of self-service car washes. We match technology, canopy style and equipment to your site, bay count and investment plan.
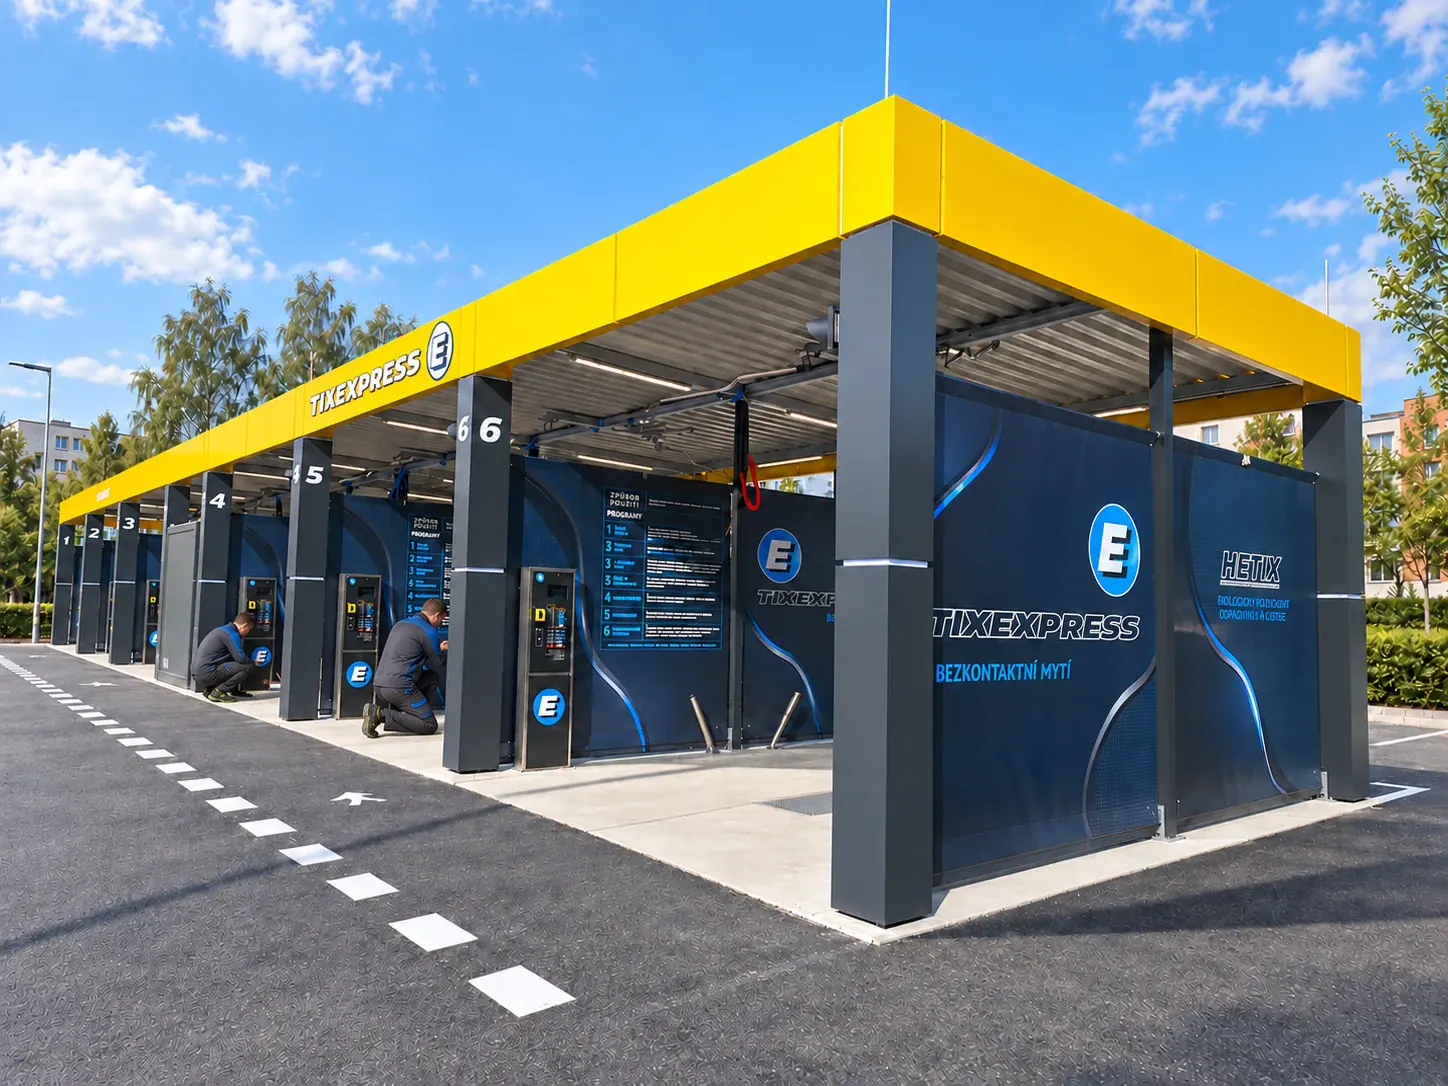
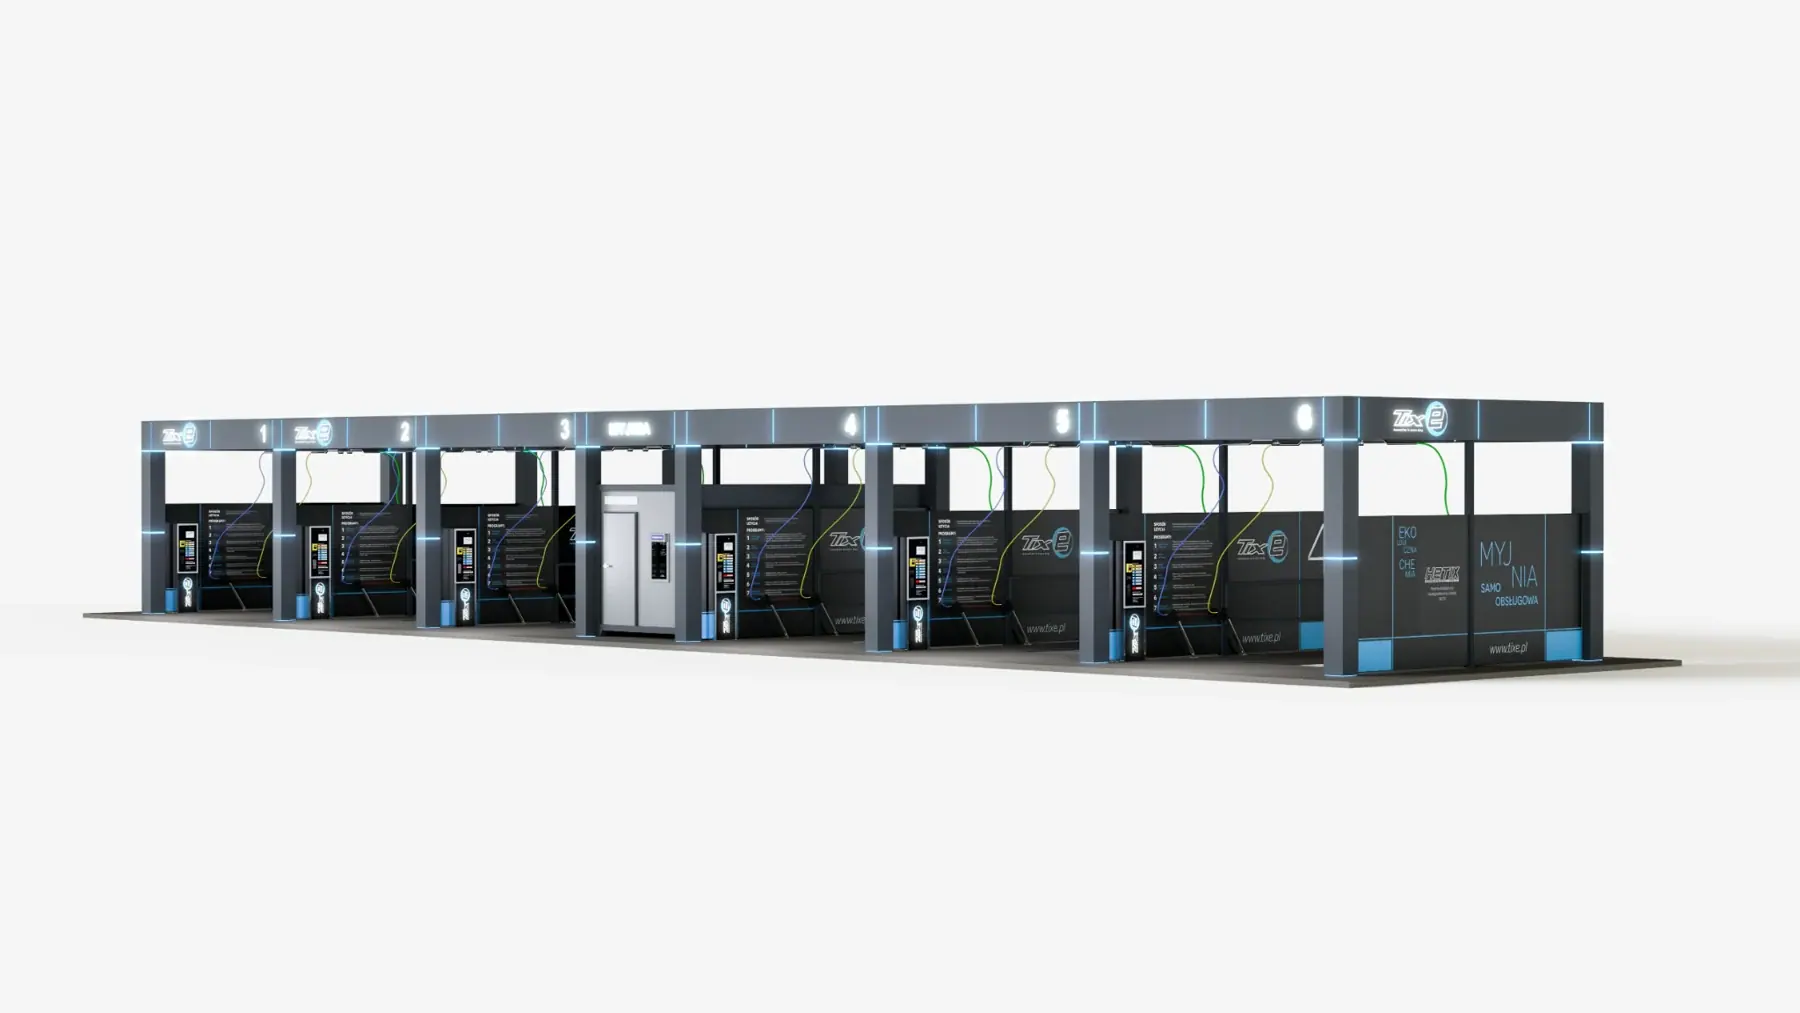
Up to 6 bays with one technical container. More technical space and wider bays allow extensive configuration, upgrades and planning for future development.
Discover Express capabilities +
More technical space
A wider technical container offers greater flexibility in equipment layout.
Bay layout
Adapt the wash space and the layout of the entire site.
Planning for growth
We establish the conditions for future expansion at the design stage.
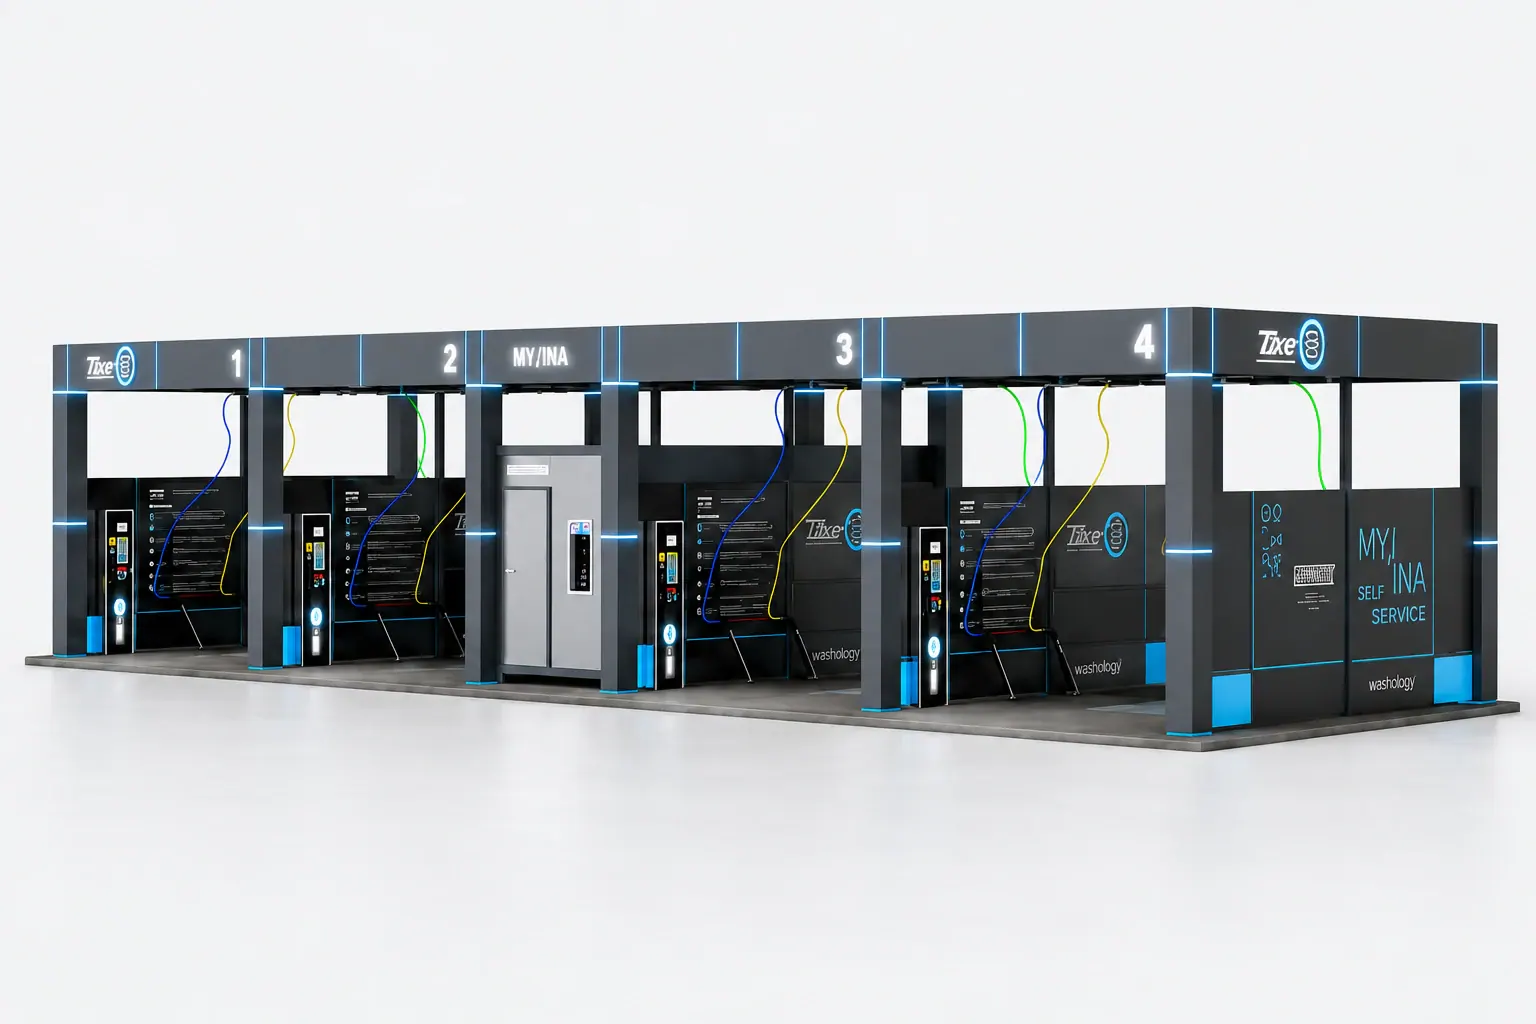
Up to 3 bays. A narrow technical container helps make the most of limited space. A solution for a predetermined scale, without later increasing the number of bays.
Discover Rapid capabilities +
Compact technical container
A solution worth considering where site space is limited.
Technology in one place
Equipment housed in the technical container is easier to access for maintenance.
A configuration for your investment
We select wash programmes, payment systems and equipment to suit your site plan.
Define the final scale from the start
Rapid supports up to 3 bays. If you are planning a larger site or future expansion, talk to us about Express.
Explore TIXE self-service car wash projects — from completed sites to the successive stages of installation. See bay layouts, canopy styles and equipment used in individual projects.
Explore TIXE technologies for touchless car washes: from water management and wash quality to payments and management. See how individual systems support day-to-day operation.
6 of 17 solutions · a selection to get started
Swipe to explore the technologies.
Water recovery
CYCLO-BOOSTER
Treats process wastewater and enables the recovered water to be reused in the car wash.
Wash system operation
MULTI-BAR DRAGON
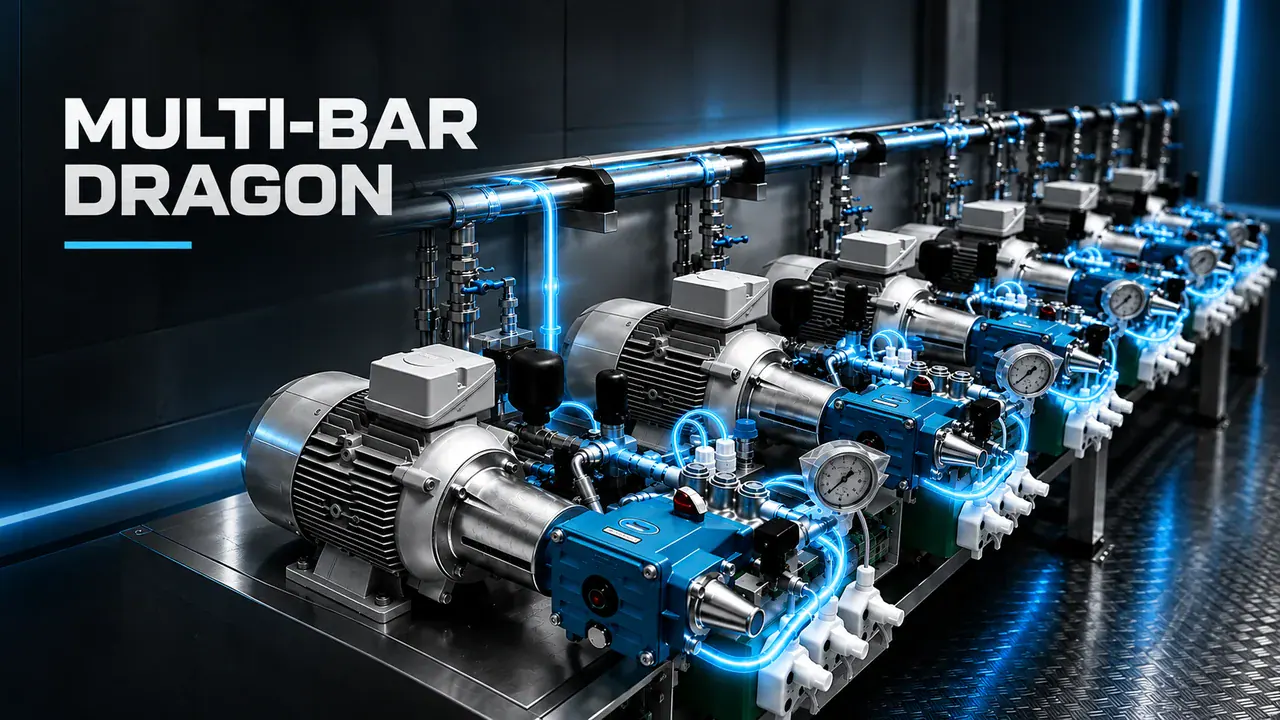
A system designed to reduce water and energy consumption and the load on key components.
Wash quality
DOUBLE POWER
Supports the brush washing system: intensive aeration produces abundant foam and helps remove dirt.
Heating control
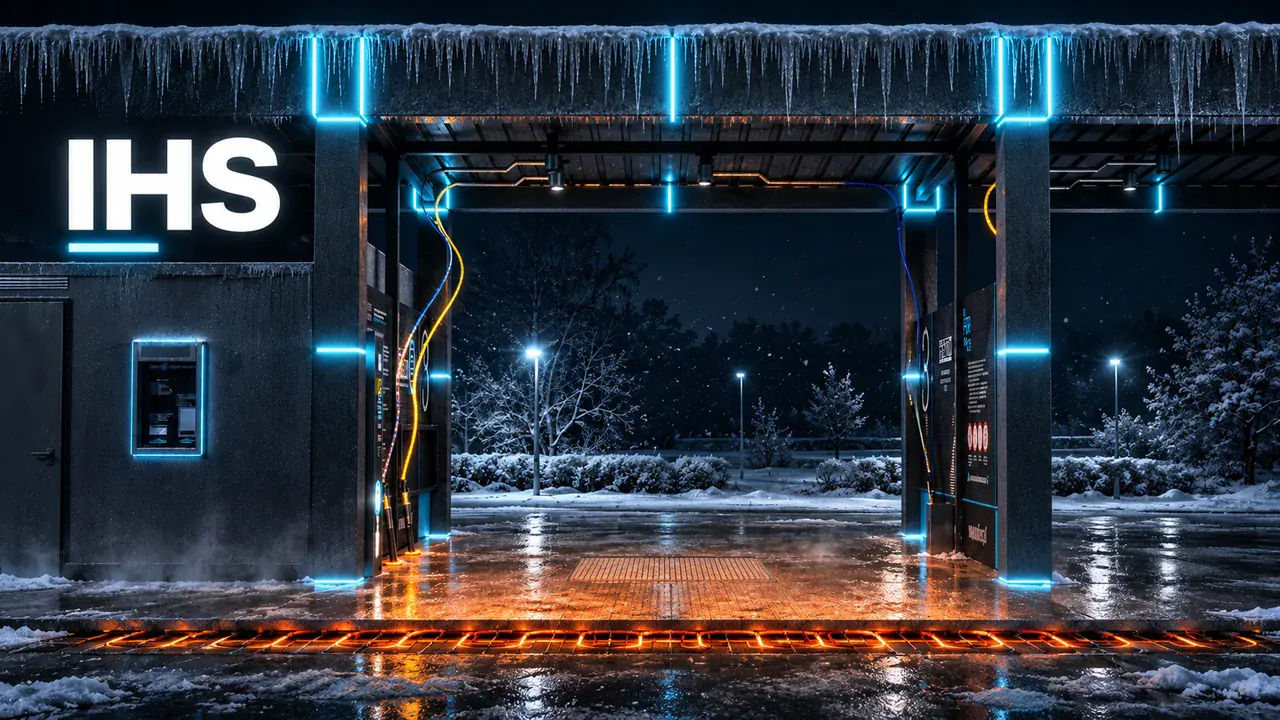
IHS
Sensors in the floor allow heating to be adjusted to bay temperature.
Remote management
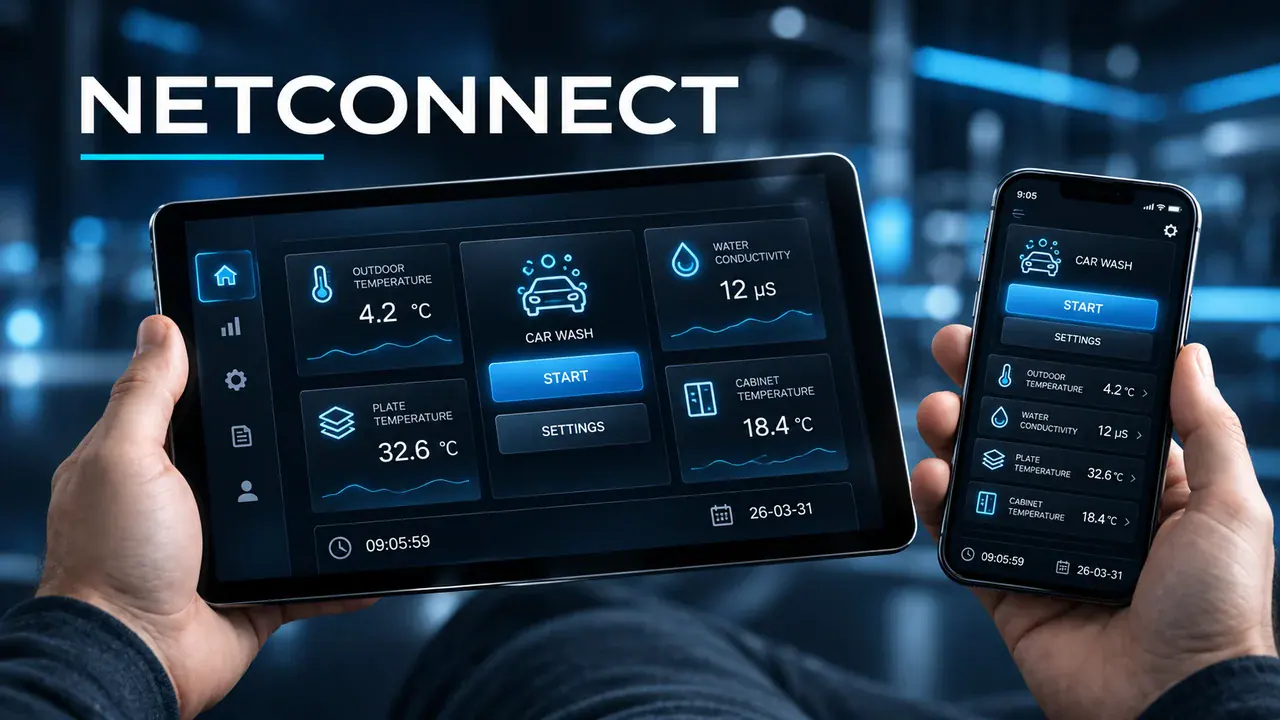
NetConnect
Statistics and app-based control functions make the car wash easier to manage even when you are off site.
Convenient payments
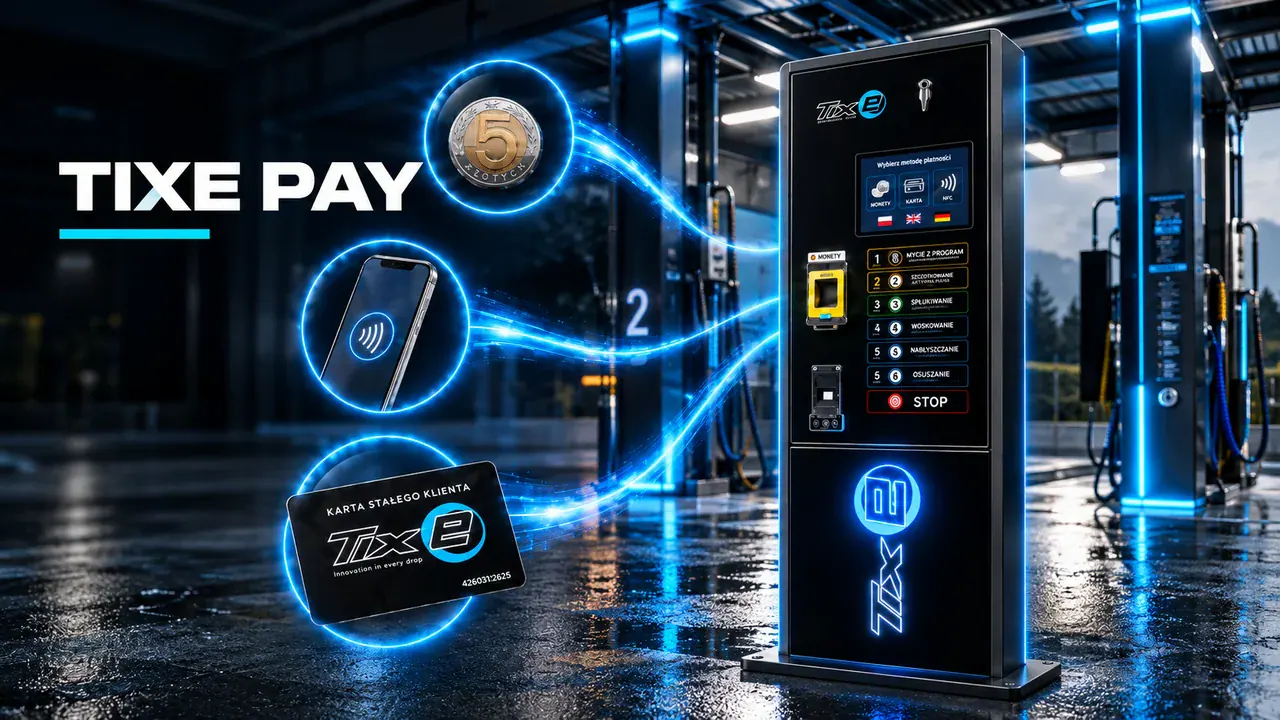
TIXE PAY
A choice of cash and cashless payment methods gives drivers a convenient way to pay for a service.
Preparing for frost
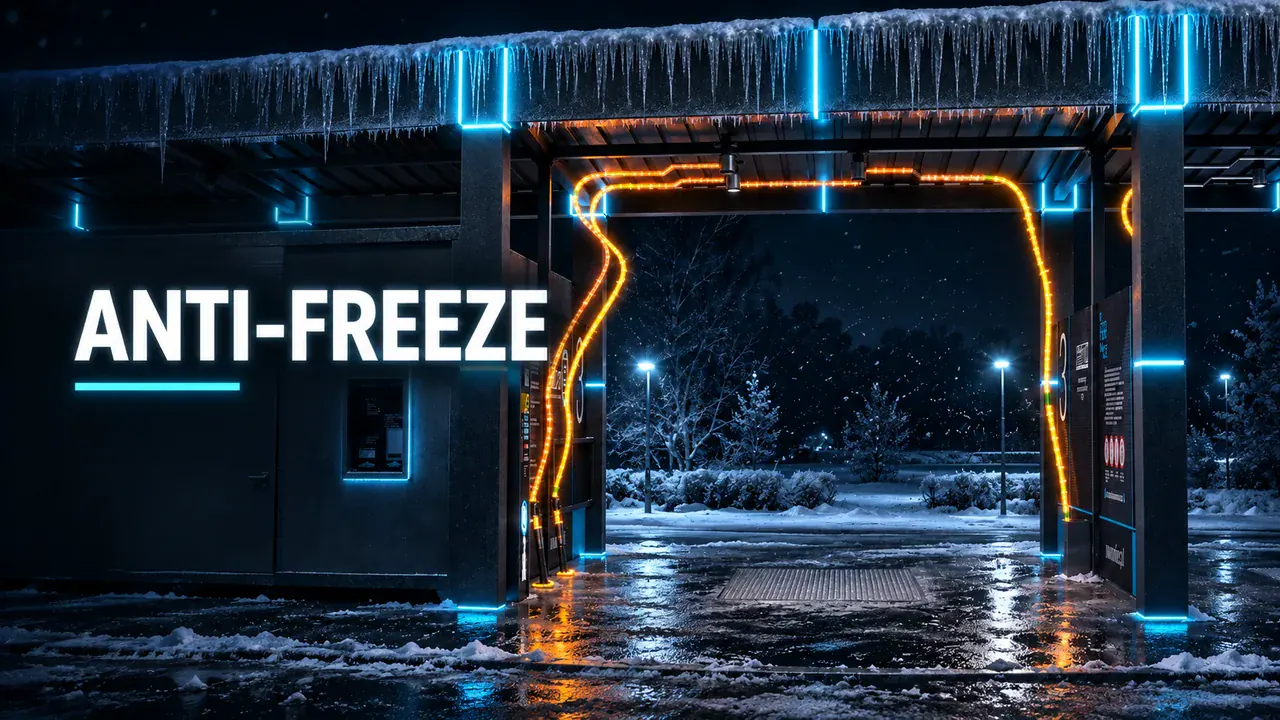
ANTI-FREEZE
Automatically controls freeze protection for the wash system at low temperatures.
A second life for osmosis water
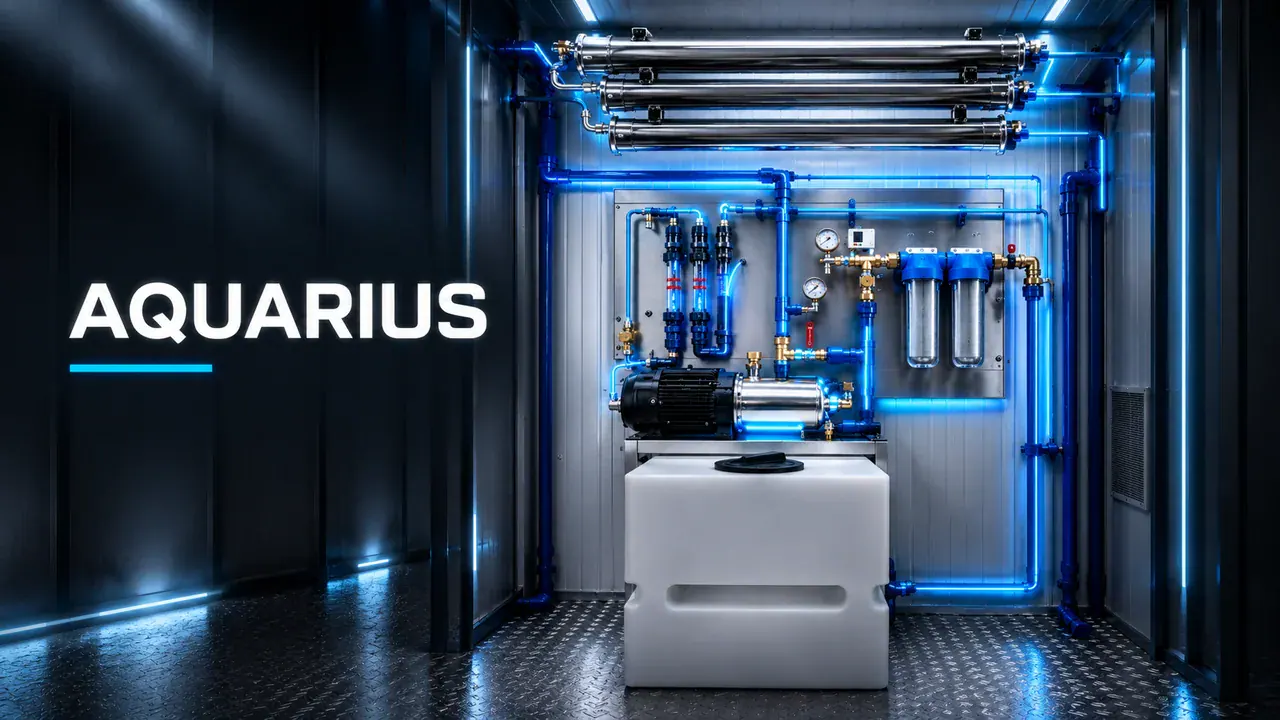
AQUARIUS
Collects reverse osmosis reject water so it can be used, for example, to clean the site.
Automatic coin transport
OCTOPUS
Transfers coins and tokens from bay control panels to collection boxes in the technical container, making cash collection easier.
Supplying the change machine
COIN FLOW
Directs coins collected in the technical container to the change machine, reducing the need for manual refilling.
Stable water supply
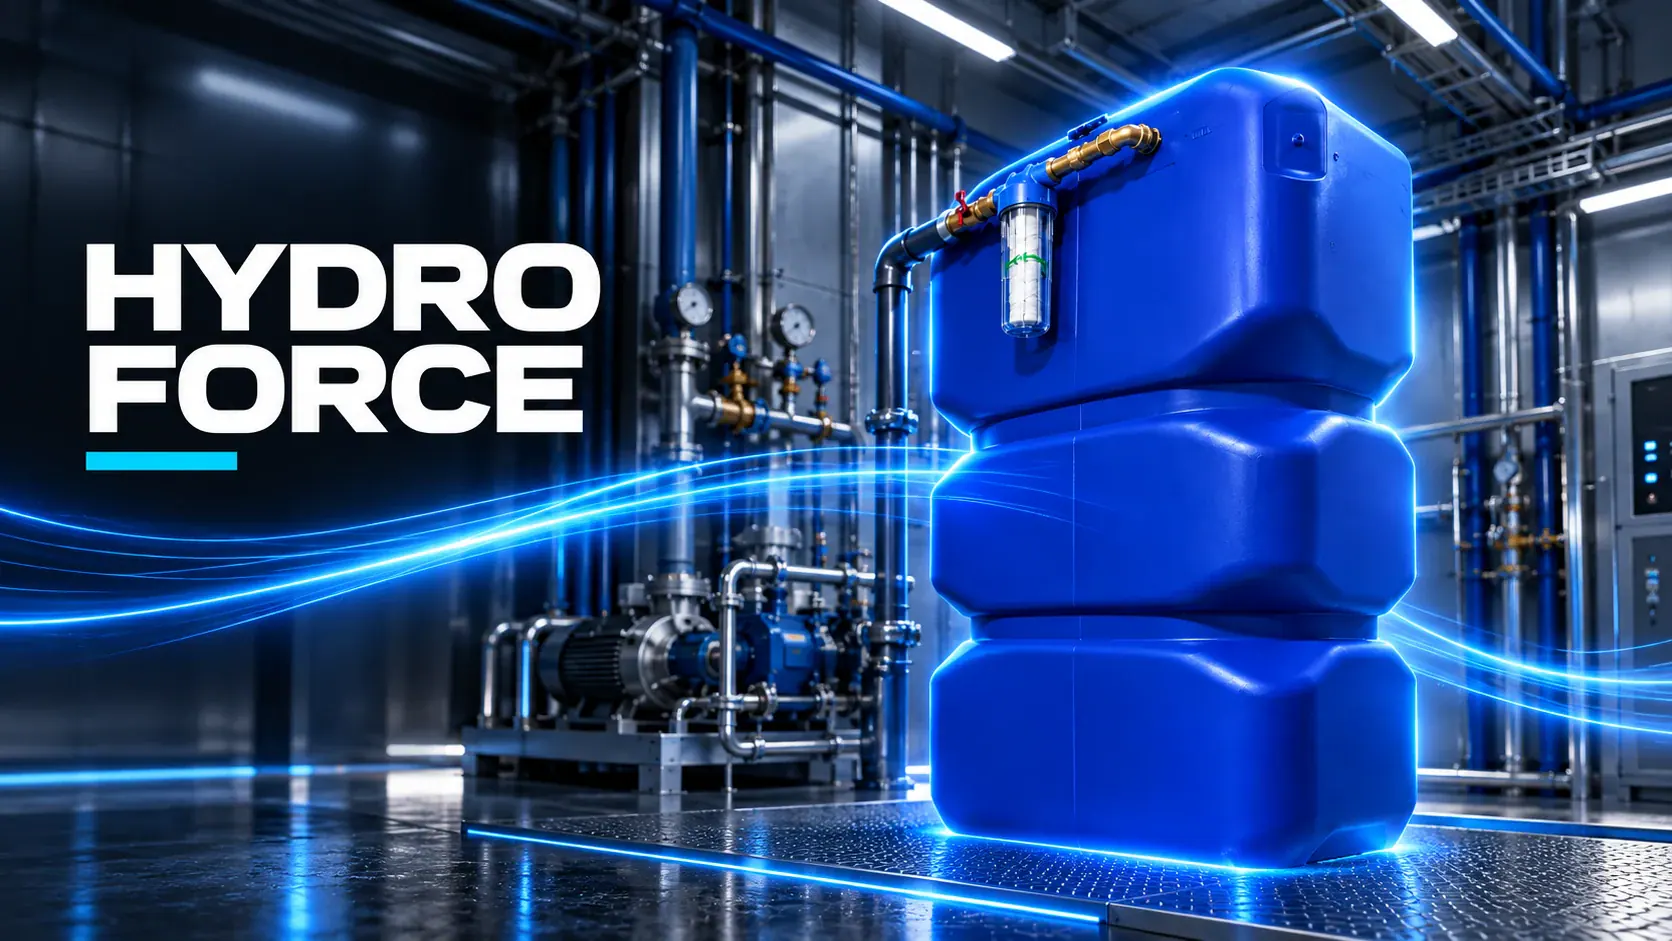
HYDRO FORCE
Boosts and stabilises the water supply pressure when connection parameters fluctuate.
Water prepared for washing
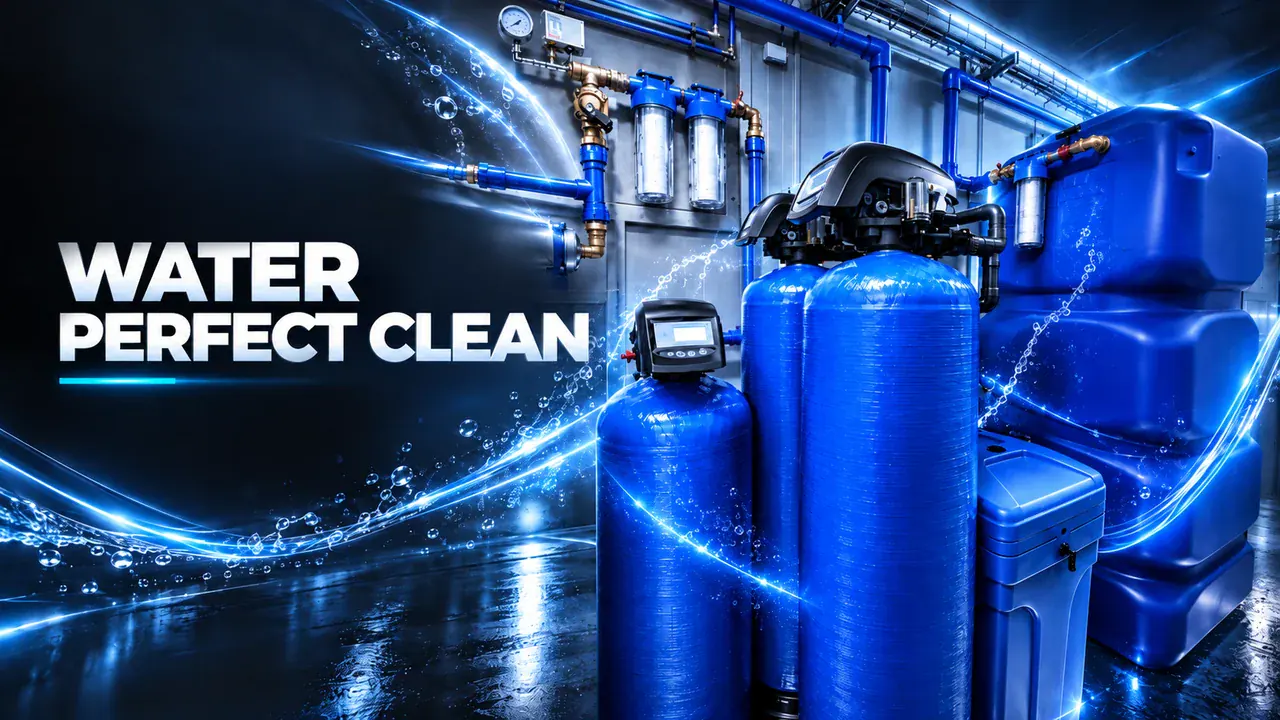
WATER PERFECT CLEAN
Combines filtration, softening and reverse osmosis to prepare water for washing and final rinsing.
Equipment protection
TECH SECURITY
Protective measures support the installation during brief interruptions to the water or power supply.
Convenient technical maintenance
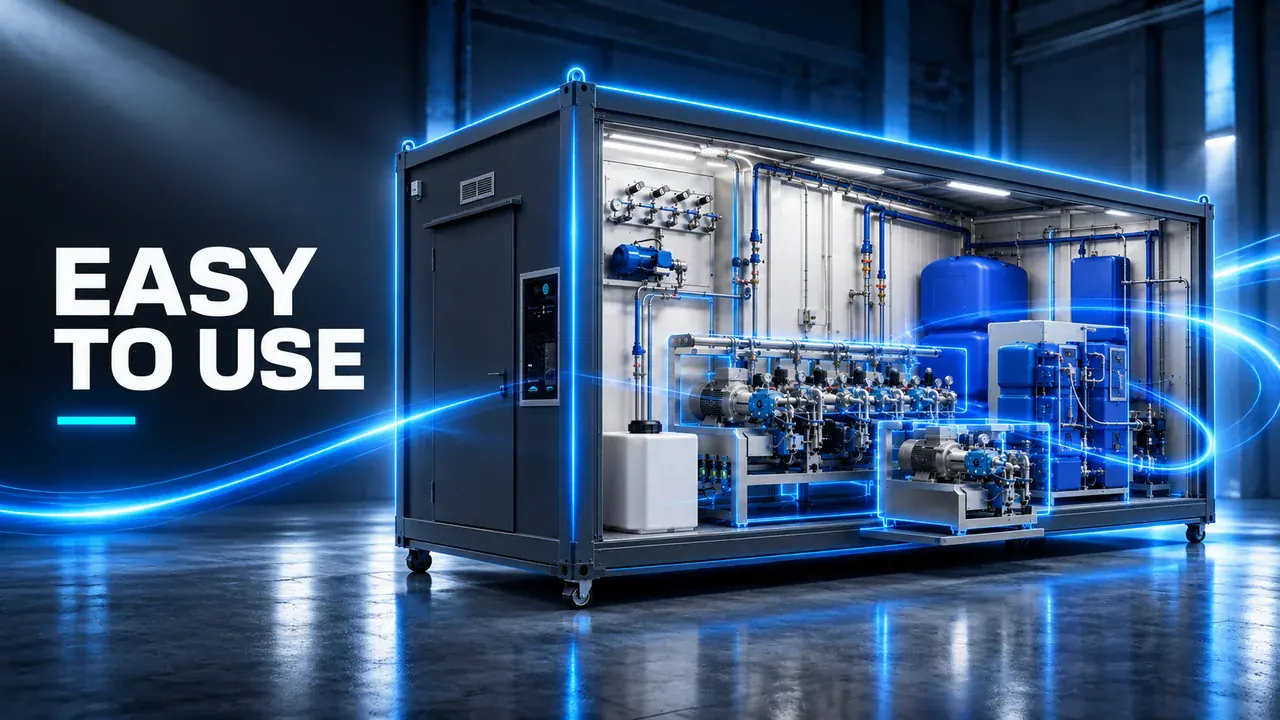
EASY TO USE
A considered layout of equipment, dosing and controls makes daily operation and servicing easier.
Relationships with regular customers
TIXE CARD
Loyalty cards help develop offers for regular customers and fleets, with terms tailored to the car wash.
Technology from an advanced manufacturing facility
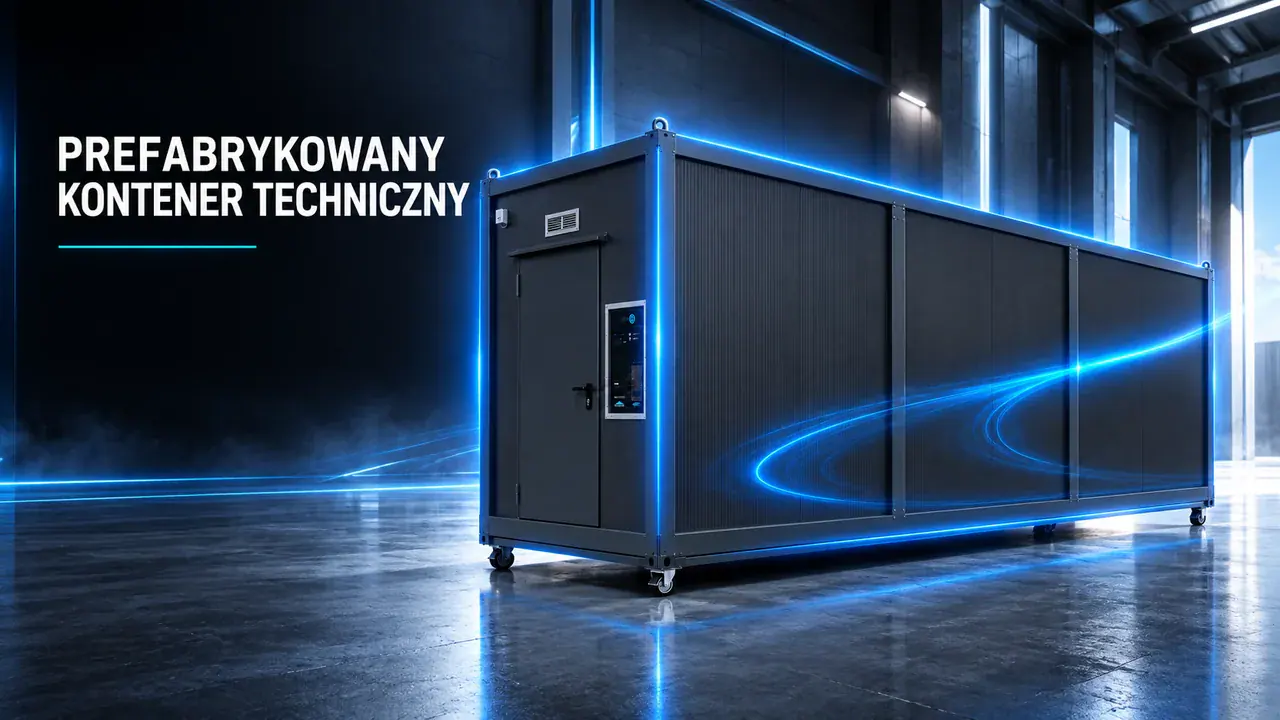
Prefabricated technical container
We assemble and test the equipment at the TIXE factory. The completed technical container is delivered to the project site.
Ready for assembly
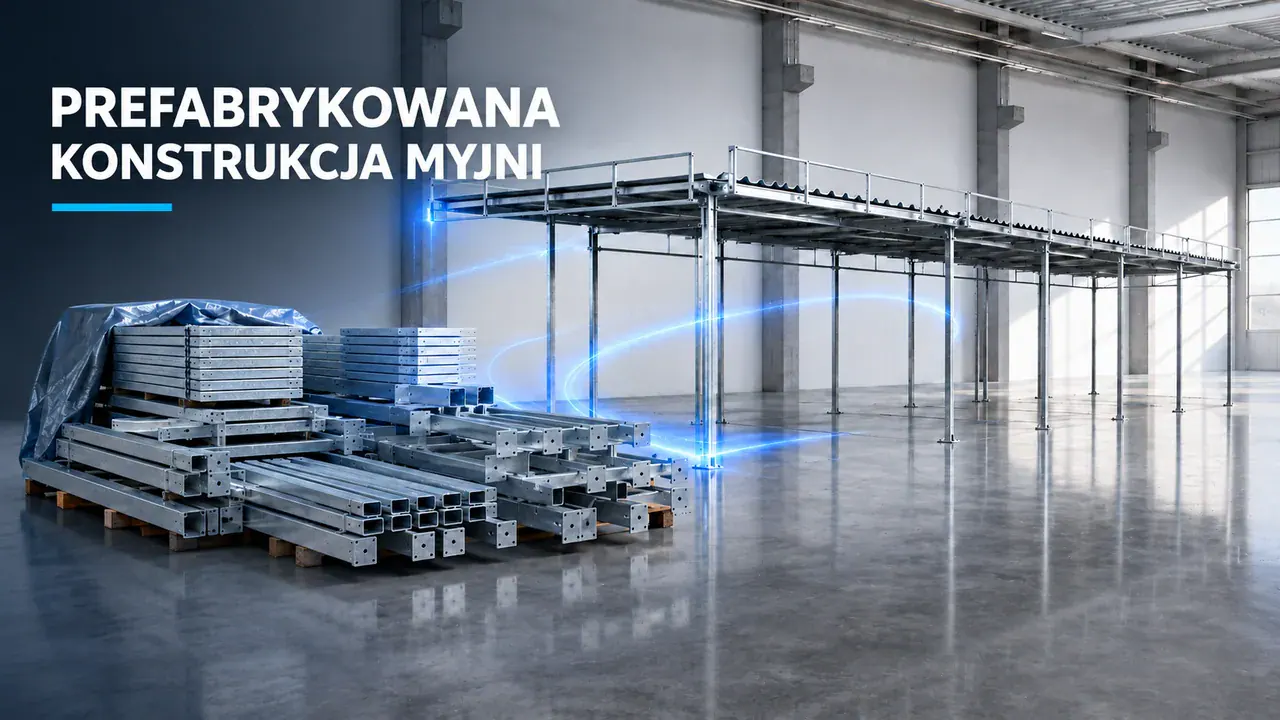
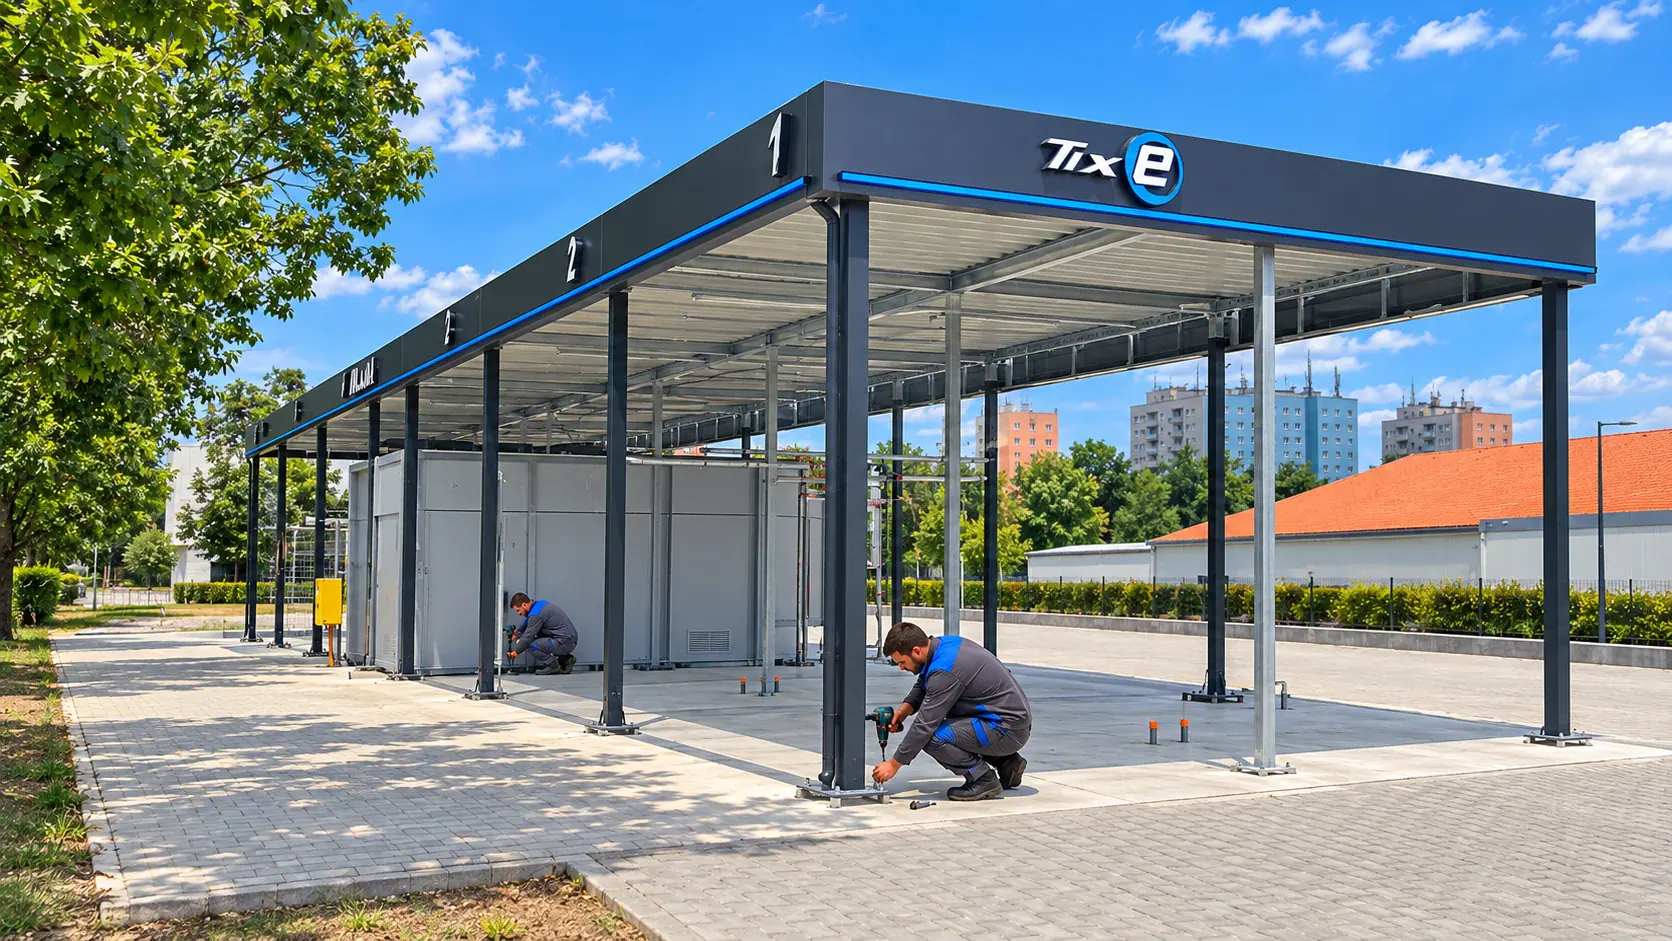
Prefabricated car wash structure
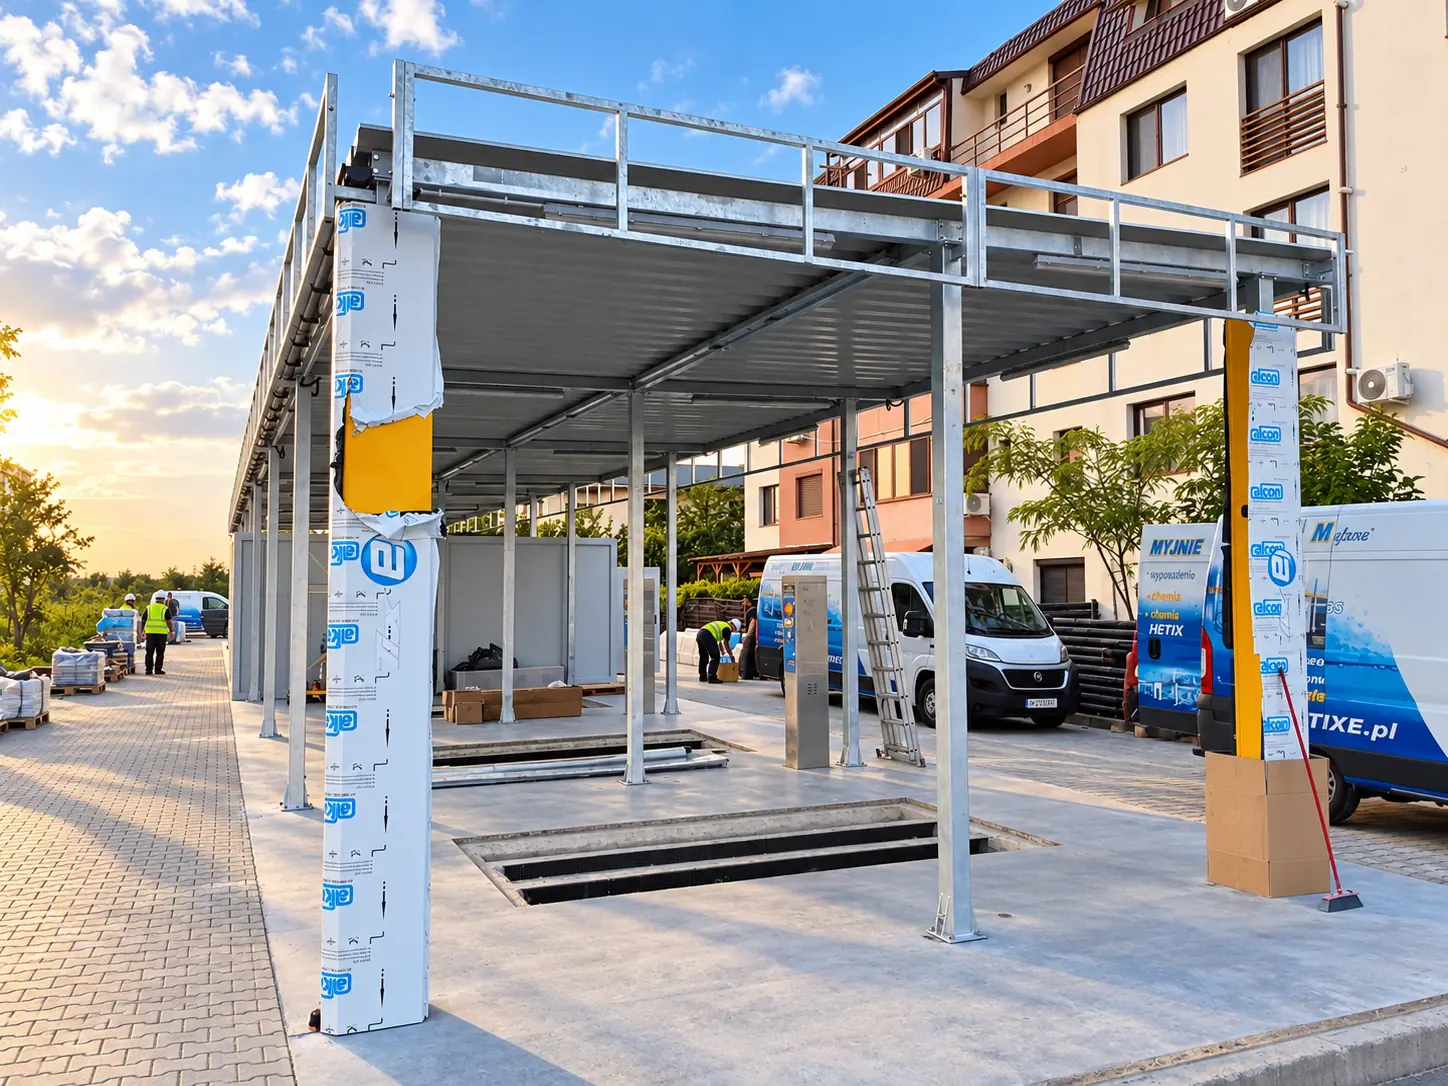
We prepare structural components at the factory and assemble them on site to the design for your car wash.
Two zones. One partner.
Building a car wash or developing an existing one?
The Investor zone helps you prepare to build a car wash — from assessing the site to selecting technology. The Partner zone supports owners of operating sites with servicing, upgrades and equipment selection.
Car wash upgrades. See the transformation in Zabrze.
BeforeAfter the upgrade
Zabrze. Drag the line to see the transformation. The left and right arrow keys move the line. Home shows the photo after the upgrade; End shows the photo before it.
We upgrade car washes made by TIXE and other manufacturers. We will tailor the scope to the condition of the site and your goals.
We have collected answers to common questions about building and equipping a self-service car wash. If your topic is not covered, discuss your project's specific needs with the TIXE team.
I do not have a site yet. Is it worth talking now? +
Yes. We can help define the requirements for your planned car wash and assess a potential location. This is a good time to match your idea to the project's possibilities.
What determines the cost of building a car wash? +
The location, site preparation, number of bays, technology and equipment. We start by defining the scope of the project so the quotation reflects your needs.
How do Rapid and Express differ? +
Rapid uses a compact technical container and helps make the most of limited space. Express offers more technical space. The canopy style is selected separately.
See both linesHow long does it take to open a car wash? +
The schedule depends on site preparation, permits, utility connections and the scope of work. Prefabricated components make on-site assembly more efficient. Timelines are agreed for each project.
Can an existing car wash be developed further? +
Yes. Depending on the condition and configuration of the site, we can suggest additional programmes, equipment, payment options or technology systems. We start by assessing the car wash and your goals.
TIXE guides
Guides for investors and car wash owners.
From the initial concept to day-to-day operation. Find practical guidance on construction, technology, costs and car wash upgrades.
Plan your self-service car wash: from choosing the site and budget to selecting technology. TIXE will help organise the decisions ahead and prepare the project brief.
We will check the surrounding area, access, utilities and development potential.
01Customers and surroundings+
Consider where customers may come from: residential areas, nearby businesses or daily routes. Compare the services, availability and operating approach of nearby car washes.
Check the approach from both directions. Assess visibility, turning opportunities and space for queues. High road traffic must be considered alongside how easy it actually is to enter the site.
03Utilities and ground conditions+
Confirm the conditions for power and water supply, wastewater discharge and rainwater management. A lack of mains water, sewerage or gas does not necessarily rule out a project — alternatives require technical and regulatory assessment. Also check underground utilities and building lines.
04Development potential+
Check the local spatial development plan with the municipality. If there is no plan, ask your designer whether a zoning decision is required. TIXE's investment department can help prepare technical data for further consultations.
For an initial assessment of TIXE layouts, we use an indicative minimum of 18.5 m width for a drive-through car wash or 15.5 m for a non-drive-through car wash. These are design assumptions, not a universal statutory minimum. Development potential also depends on boundaries, utilities, building lines and circulation.
Budget and economics
What makes up the cost of a car wash?
Individual budget4 investment areas
Site and documentation
Car wash and equipment
Works and utility connections
Marketing
Every project has its own budget. The site, car wash size, equipment and scope of work affect the cost breakdown.
Site and documentation
Purchase or lease, design and regulatory preparation depending on the location.
Car wash and equipment
Number of bays, canopy style, technologies and additional equipment.
Works and utility connections
Ground conditions, access to utilities and the scope of on-site work.
Marketing
Site signage, opening promotion and reaching local customers.
Illustrative chart. Costs are determined individually.
We will estimate investment costs, operating costs and revenue under several scenarios.
How can potential revenue be assessed?+
Start with the number of washes and average transaction value, supported by a location analysis. Account for seasonality, competition and the time needed to attract customers. These assumptions should be tested under several scenarios.
Water, electricity, heating, chemicals, payments, servicing and spare parts. Add fixed costs relevant to your project, including rent, insurance, accounting, taxes and financing. Revenue and the amount remaining after costs are different figures.
What should I prepare for a financing discussion?+
A full cost estimate, spending schedule and information about your planned equity contribution. Combine the technology quotation with the costs of the site and construction work. Financing availability and terms are determined by the financing institution.
Own funds — staged payments according to the contract schedule.
Equipment leasing — scope, deposit and approval depend on the finance provider's assessment.
Investment loan — help preparing technology data, a cost estimate and a business plan.
Grants — checking current application rounds and the terms of a specific programme.
We combine the car wash layout with technology, canopy style and equipment. We clarify the scope of the quotation, design work and the investor's responsibilities.
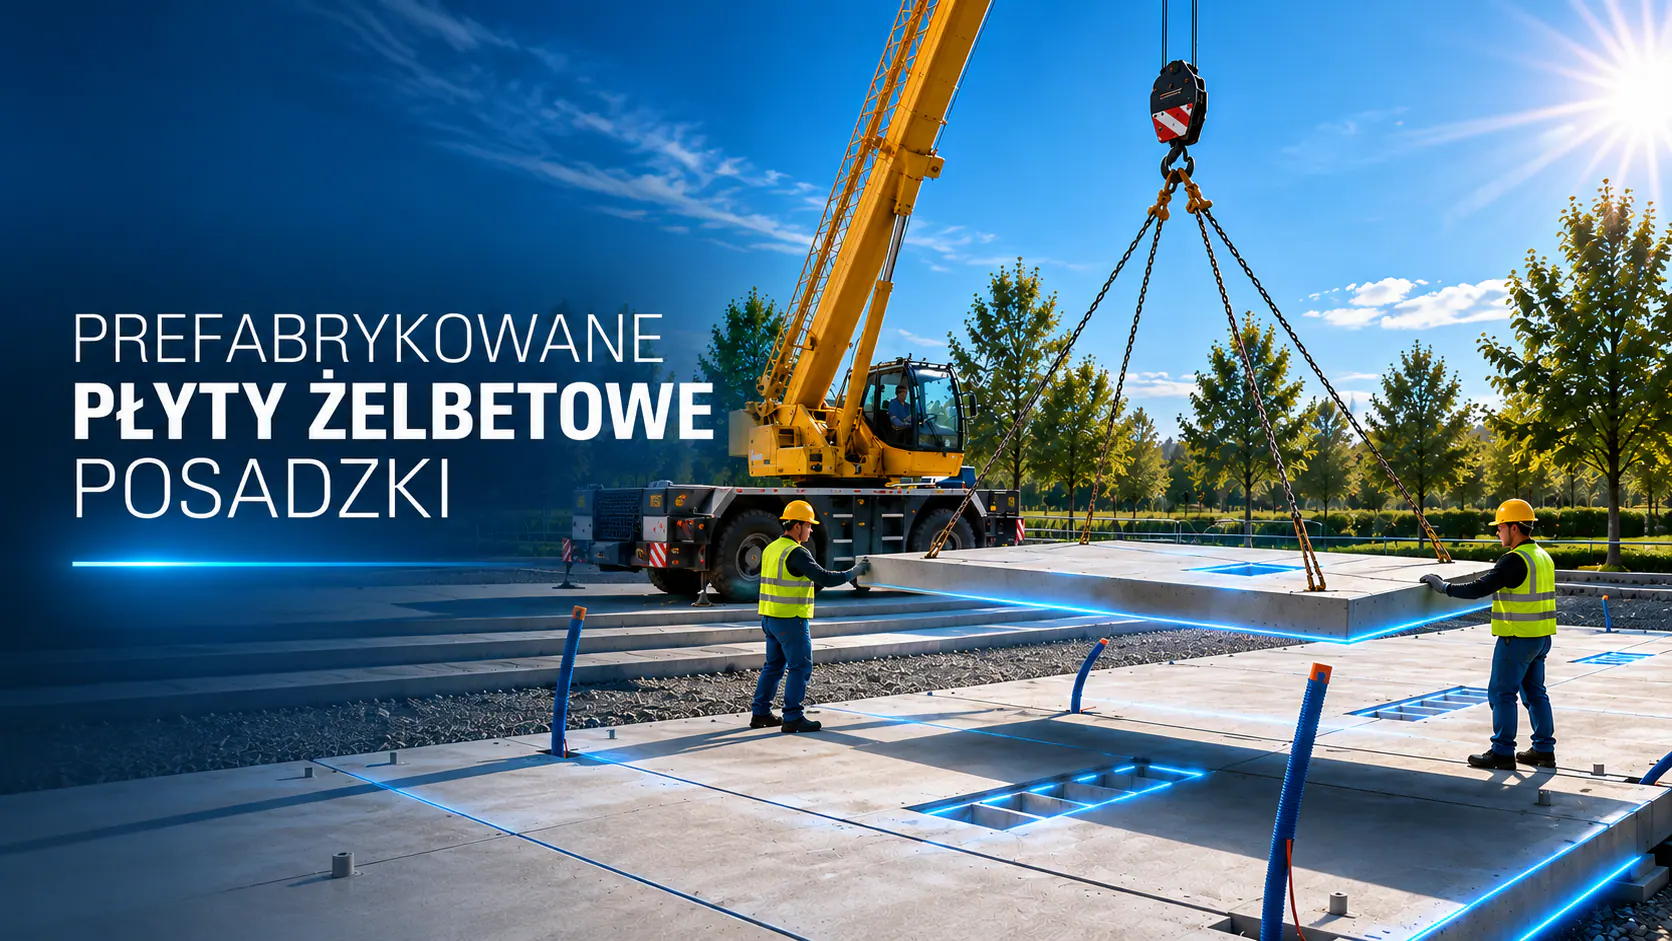
The designer checks local conditions and documentation. Work includes levelling, utility connections, underground installations, heated flooring and circulation areas. Using a TIXE prefabricated slab can shorten some of the works; the scope is agreed in the design.
Car wash production at our factory takes approximately 80–100 working days. Installation of the technical container and structure usually takes 2–6 working days. We agree the installation date once the site is confirmed ready.
Once utilities are connected and operational, we configure the technology and prepare you to operate the site. Before opening, the relevant construction completion or occupancy approval procedure must be completed. We then support you with servicing, spare parts and chemical selection.
3 areas of analysis. Free of charge.Complete the form — we will help assess your project's potential.
01 Regional analysis
Surroundings, competition and customer potential.
02 Economic analysis
Investment costs, operating costs and revenue scenarios.
03 Site assessment
Bay layout, access, utilities and data for further consultations.
Investor questions
What should you know before deciding?
Is the car wash design included in the price?+
After a car wash supply contract is signed, we prepare the design at no additional charge. In other cases, we charge a deposit which is settled when the contract is fulfilled.
The design must be adapted by a local designer. The scope of documentation, adaptation and approvals is agreed for each project.
Yes, the first discussion can be about an initial idea. A town or search area, intended scale and your questions are enough. This makes it easier to identify the data to collect before the next decisions.
The area required depends on the number of bays, site shape, access and equipment. In addition to the structure, allow for queues, circulation, vacuum cleaners and equipment maintenance access. We check the specific layout on a map.
Once we know the location and agree the car wash scope: bays, technology, canopy style and equipment. Site, construction and connection costs require information specific to the plot. The quotation should clearly identify items still awaiting pricing.
Preparatory site works take approximately 2–3 months, while installation of the technical container and structure takes 2–6 working days. The overall timeline also depends on documentation, approvals, production and utility availability. We agree the schedule after assessing the specific project.
Allow for expansion from the start: in the site, bay layout and technology. Rapid is a compact line for up to 3 bays. Express supports up to 6 bays per technical container and allows planning for further development. The final arrangement of technical containers, bays and additional systems is agreed in the design.
The division of work is set out in the agreed scope. It should identify who is responsible for the site, design, permits, works and connections, and who handles delivery, installation and commissioning. This list helps check that the cost estimate and schedule are complete.
What should I consider when purchasing or leasing a site?+
Link the contract terms to confirmation that the car wash project can proceed. For a lease, discuss its duration, the right to develop the site, how investment expenditure is settled and how the relationship ends. An appropriate term follows from the financial plan; have a lawyer review the draft agreement.
Checking spatial planning, preparing building permit documentation and obtaining required approvals. Water and wastewater management may require a water permit. Required notices must be filed before work starts; completion and occupancy procedures are determined for each site.
TIXE designers help with car wash data and documentation. Confirm procedures and deadlines with the lead designer and the relevant authorities.
We help car wash owners keep their equipment in good working order and develop their services. Explore servicing, spare parts, HETIX chemicals and technology upgrade options.
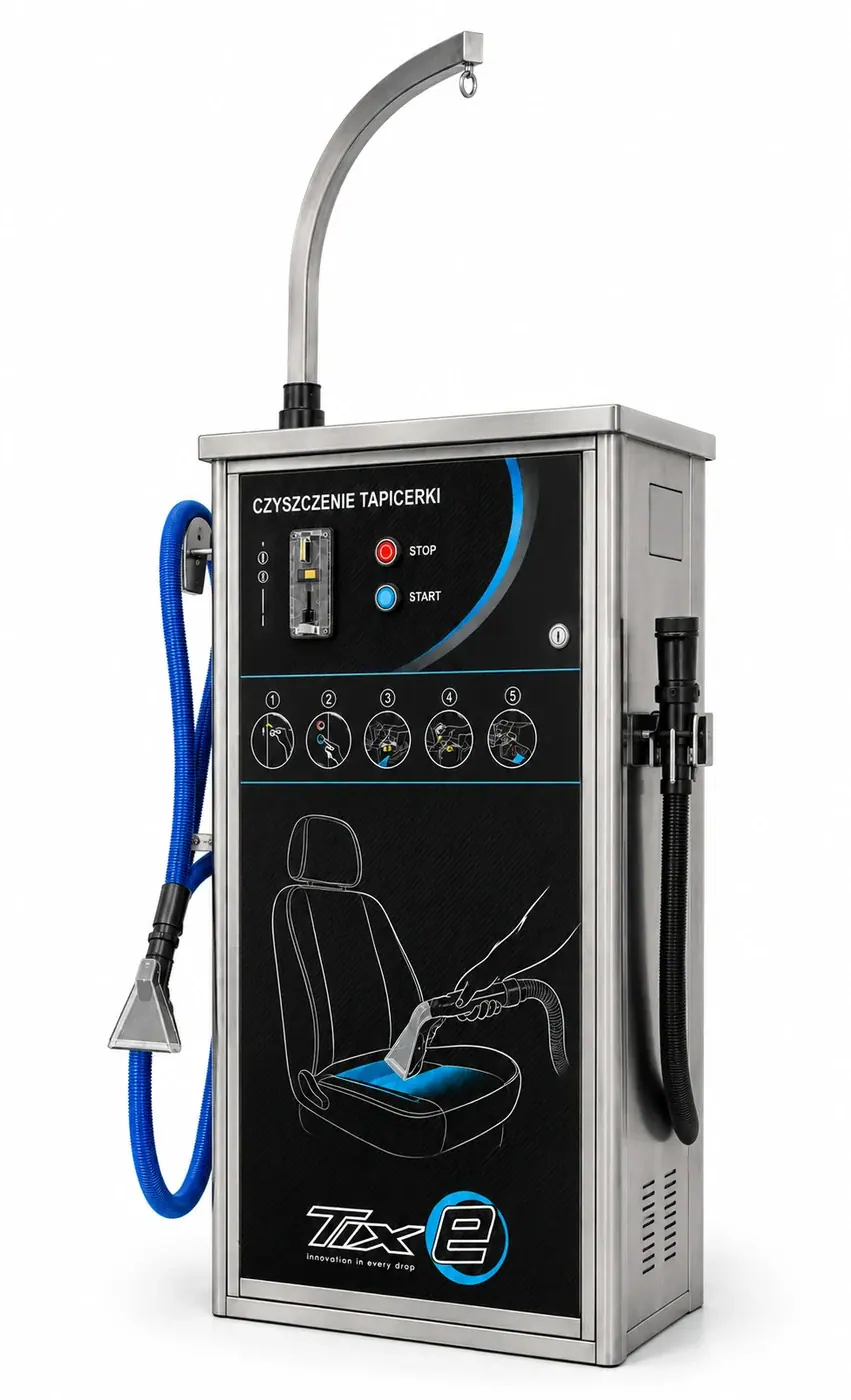
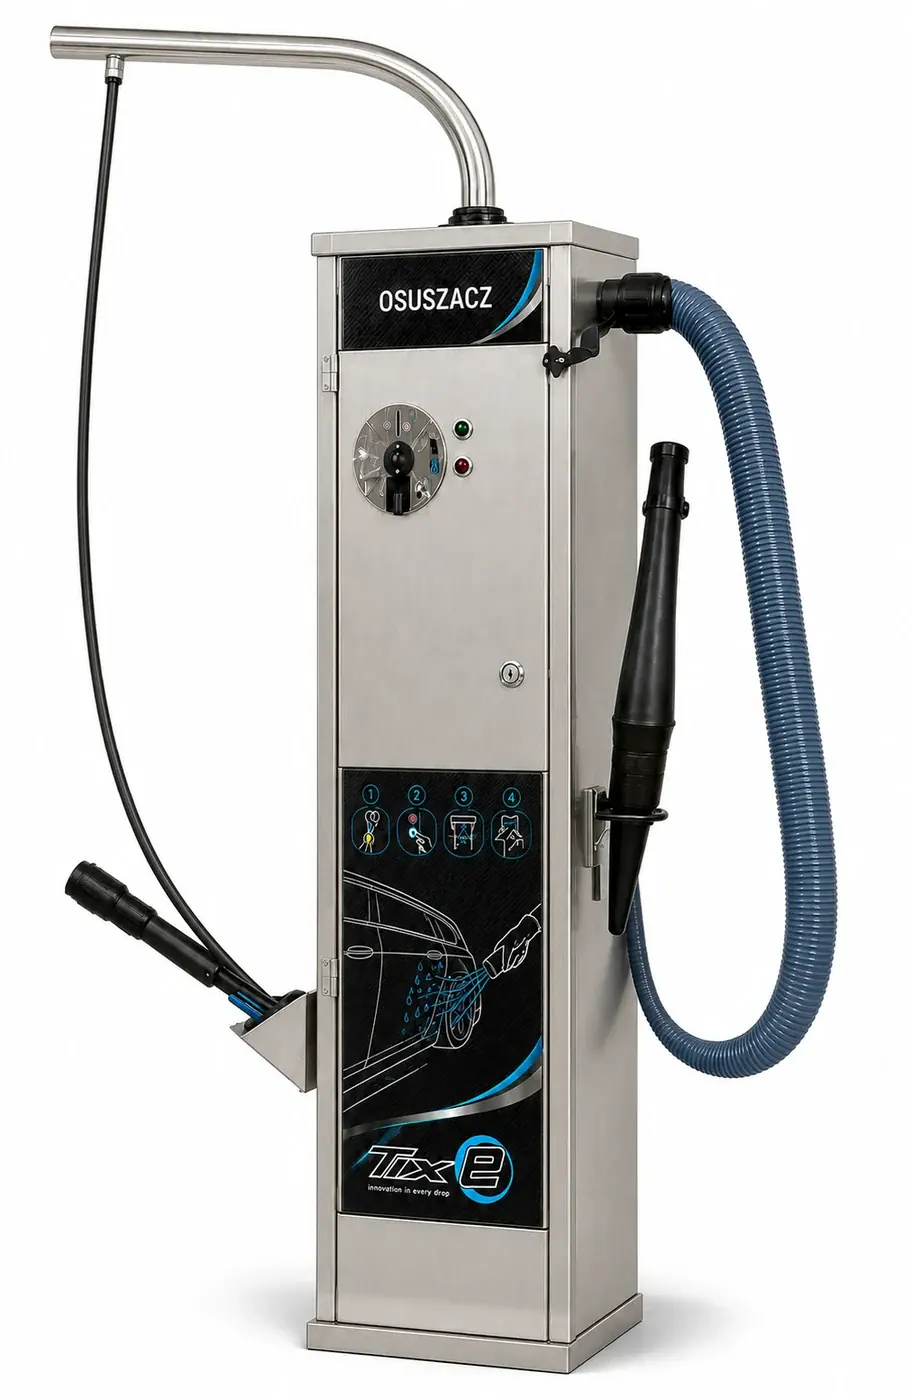
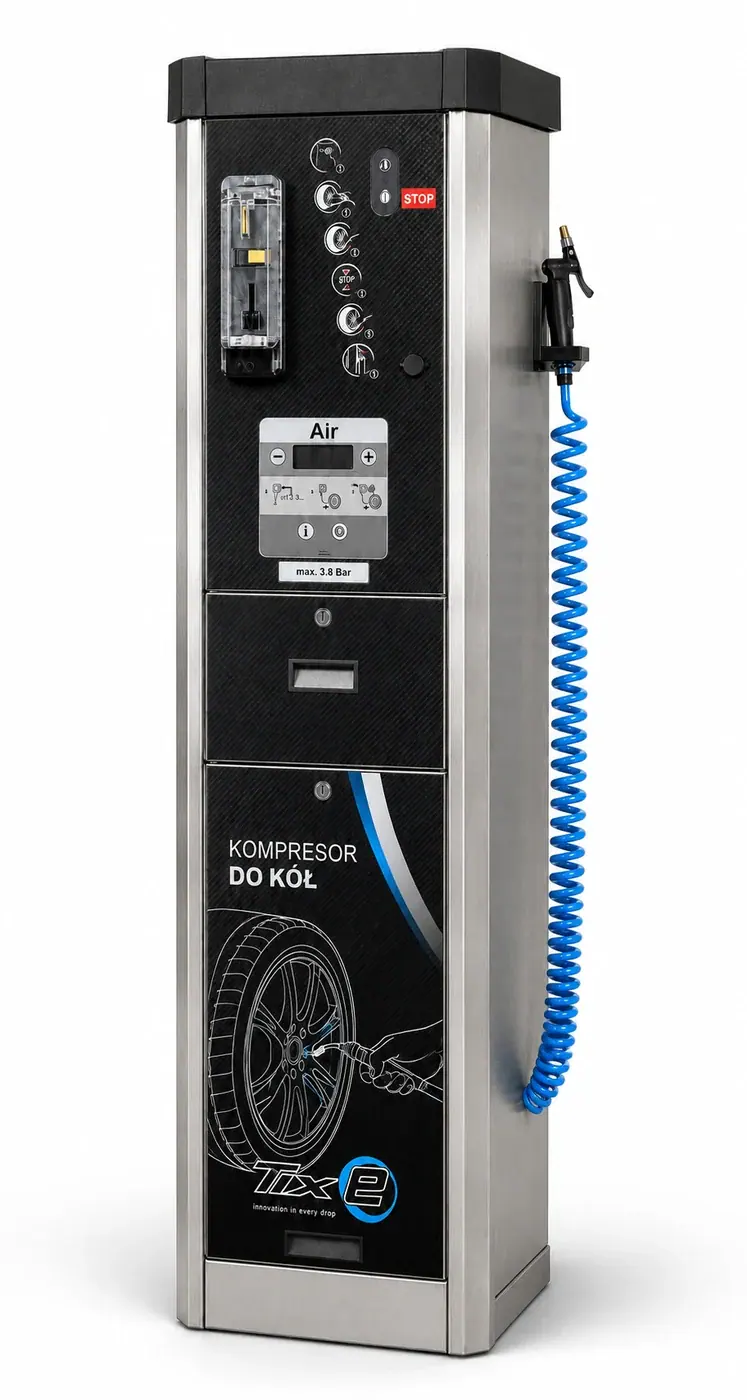
Expand your self-service car wash offer with interior care, drying and practical services for drivers. Discover TIXE equipment and accessories, their functions and available options.
Swipe through the categories or use the arrows. Select a category to go to the equipment.
Explore our current equipment
More services. In one place.
Meet more of your customers' needs. From a clean car interior to convenient banknote-to-coin exchange.
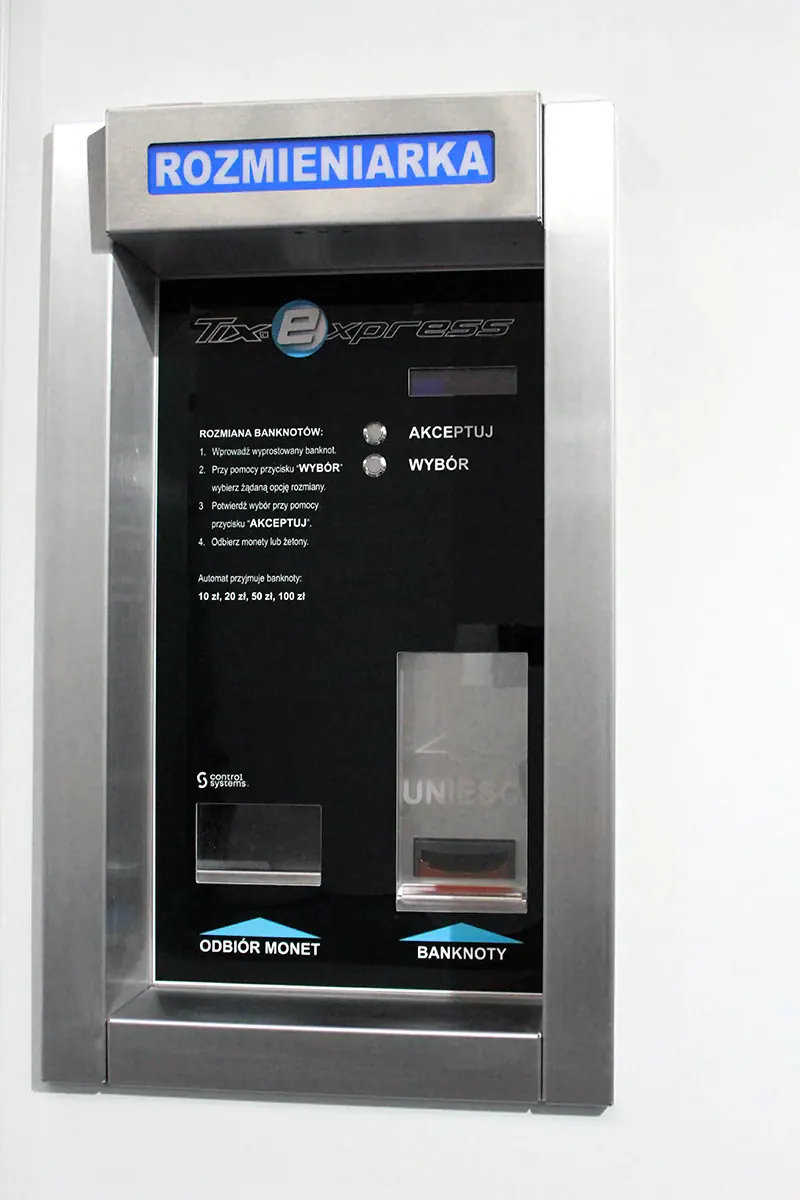
Exchange banknotes for coins or tokens. The configuration may include loyalty card support.
Details and equipment +
Key features
Heavy-gauge AISI 304 stainless steel housing.
Dispenses selected coin denominations or car wash tokens.
Clear messages, illuminated buttons and a high-capacity coin hopper.
Configuration and installation
Depending on the version: loyalty card top-ups, new card dispensing and integration with coin transport and recycling systems. The scope of integration is agreed for each car wash.
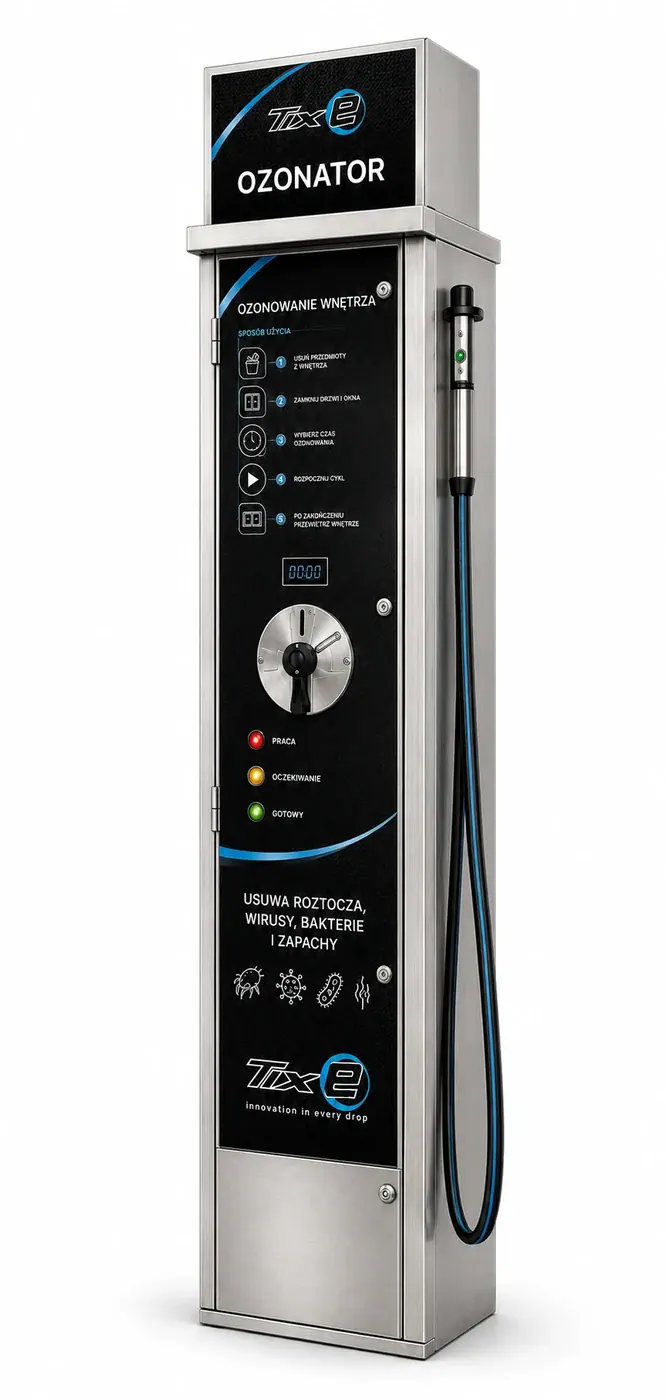
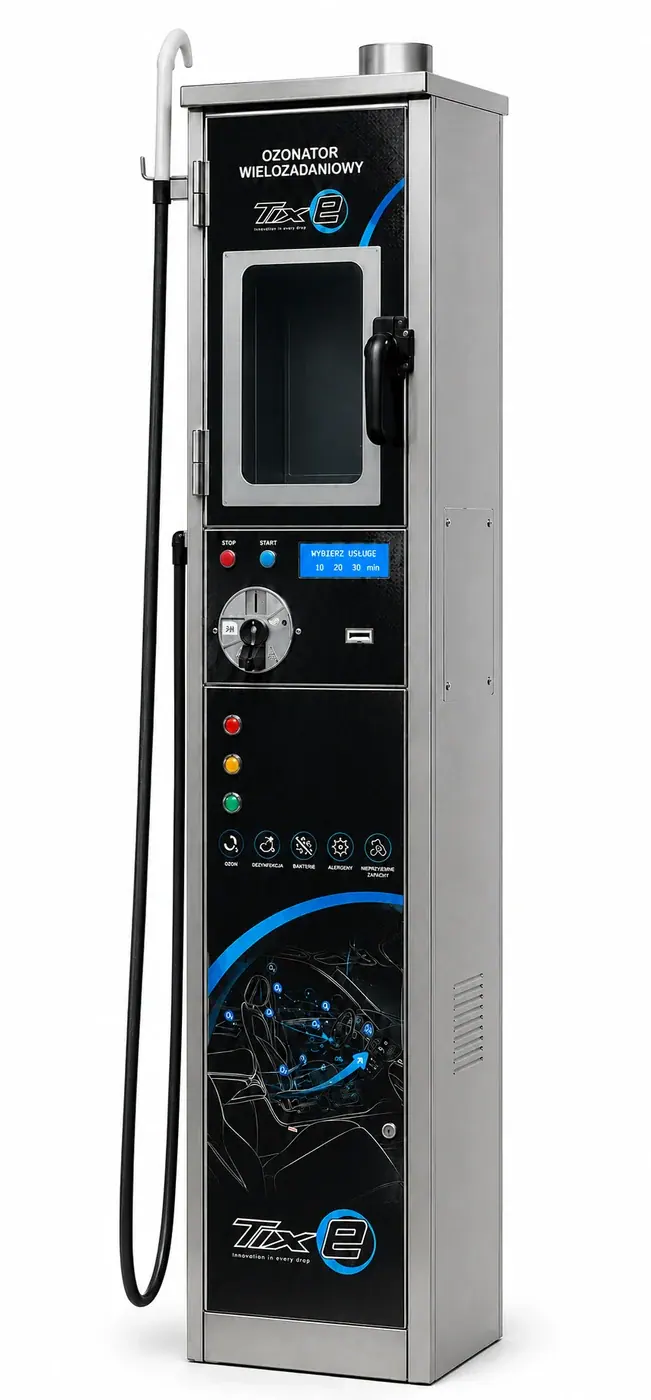
Equipment with a chamber for items and a vehicle connection, designed for odour-neutralising treatments.
Details and equipment +
Key features
AISI 304 stainless steel housing and an illuminated ozone treatment chamber.
Hose with an attachment for use at the vehicle window.
Time and price display with indicators for successive process stages.
Programmable service duration and required number of coins or tokens.
Configuration and installation
Optional payment terminal and manual activation without payment.
Item selection, ozone treatment cycle and ventilation must comply with the manufacturer's instructions. People and animals must not remain in the vehicle during treatment.
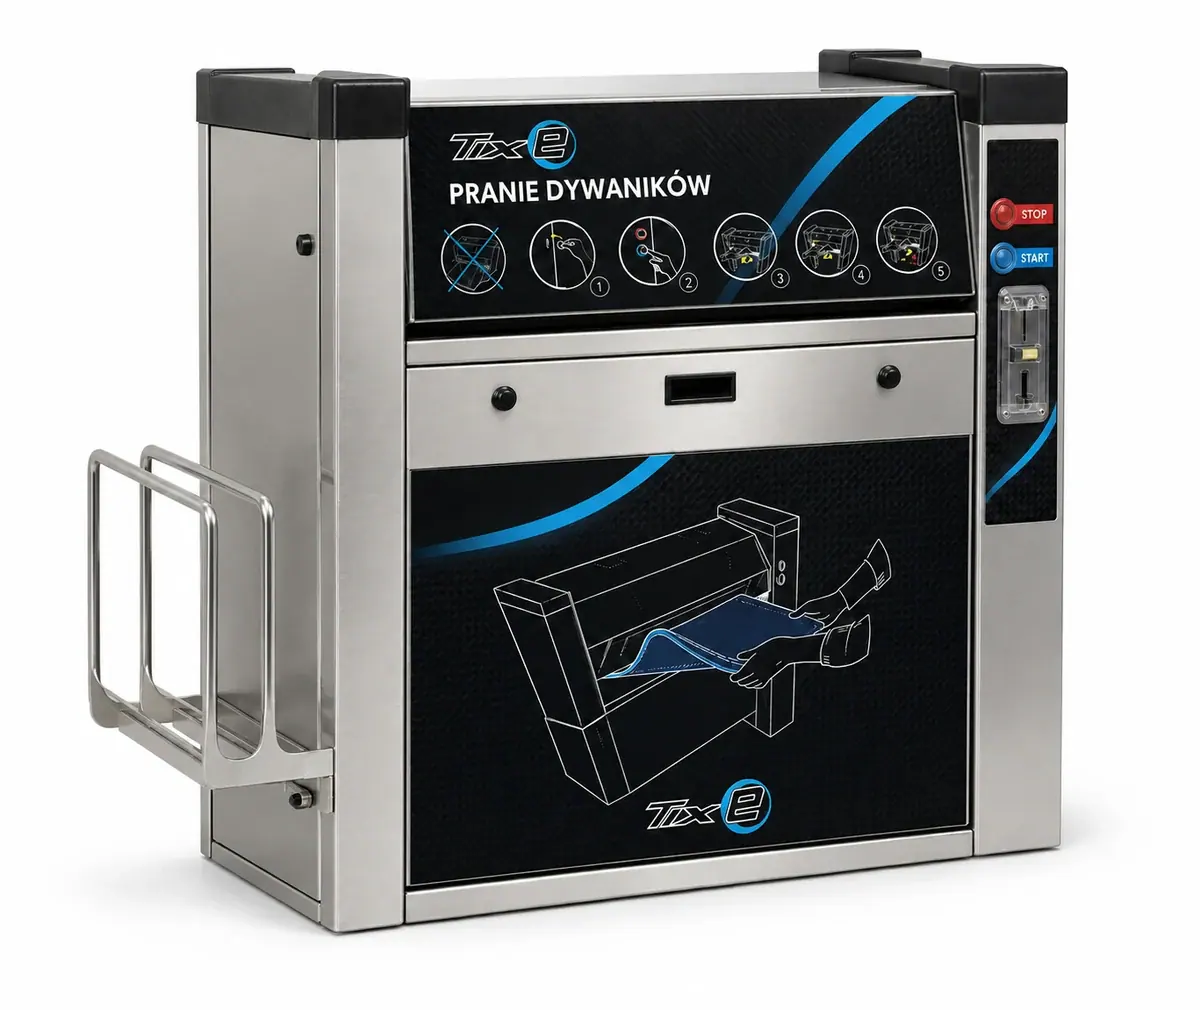
Cleans textile and rubber mats up to 80 cm wide, with a choice of dry or wet operation.
Details and equipment +
Key features
Brush system with a removable assembly for maintenance.
Components made of AISI 304 stainless steel and UV-resistant ABS.
Programmable cycle time and manual activation option.
Hinged panels simplify servicing; an integrated electrical cabinet and lockable cash box keep operation organised.
Configuration and installation
Configuration options include a control panel, LCD display, EuroKey Next, steam module, compressed air, sprayer and antifreeze system. Availability of the selected combination is confirmed during selection.
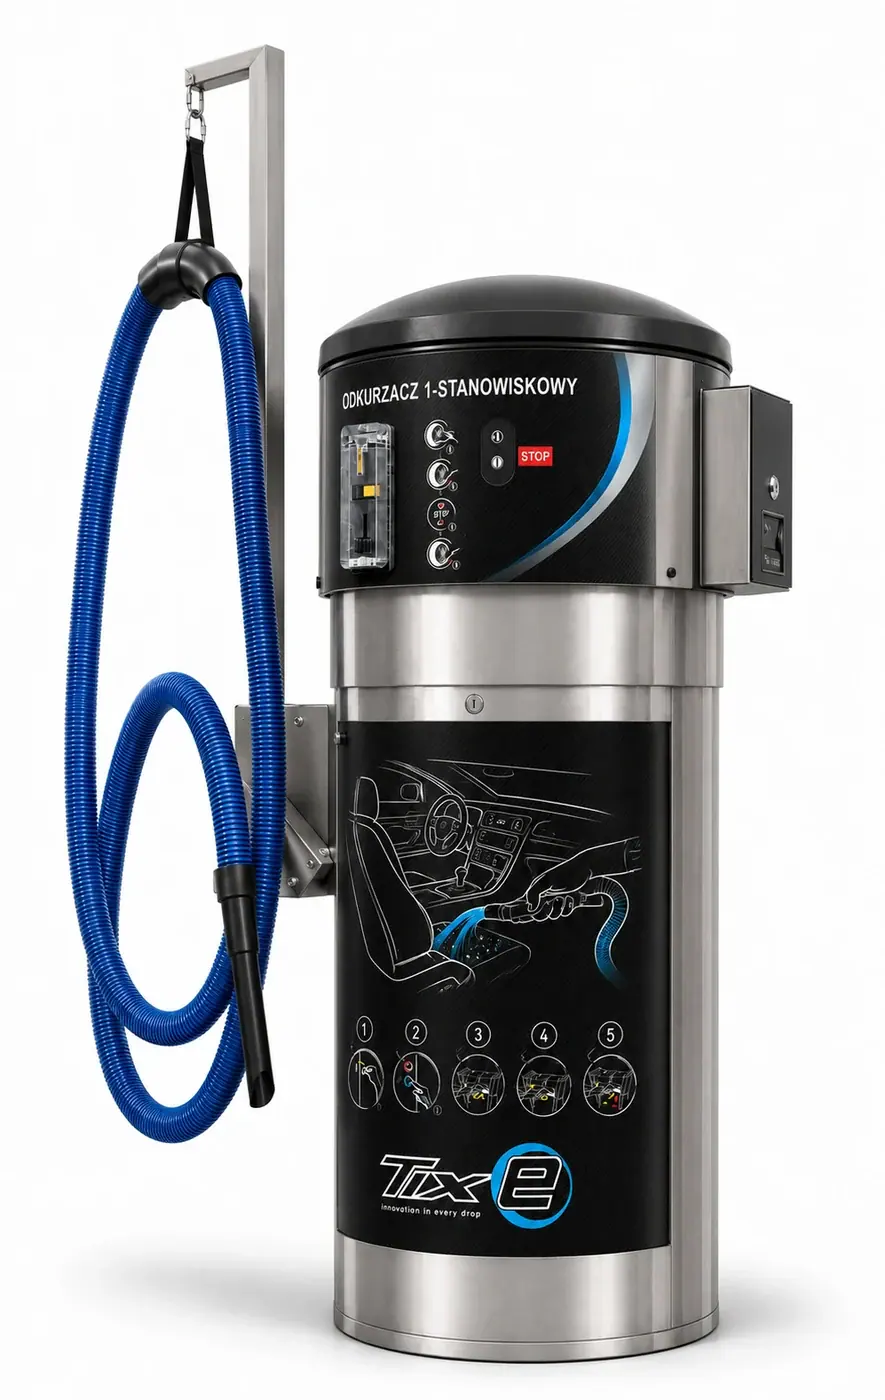
Self-service vacuuming of vehicle interiors. Island installation allows access to the unit from both sides.
Details and equipment +
Key features
AISI 304 stainless steel housing and UV-resistant ABS cover.
Four cylindrical filters, self-cleaning system and removable collection tank.
Flexible 40 mm diameter hose and a nozzle for intensive use.
Programmable operating time, coin acceptor and lockable cash box.
Requires a 400 V three-phase power supply.
Configuration and installation
Available options: swivel boom, payment terminal, central coin vacuum transport connection and a communication module linking to the TIXE car wash controller and app for analysing revenue, operating time and settings.
Swipe through the cards or use the arrows. Expand an item to see its details.
Why plan the entire site?
Each piece of equipment is part of a well-run car wash.
01
Driver convenience
Match services to customer needs. Plan clear instructions, access routes and space to work around the car.
02
Considered maintenance
Allow for servicing access, cleaning and replenishing supplies when choosing the installation location.
03
A coherent development plan
Coordinate equipment with the site layout and payment methods. Start with what your car wash needs today.
Equipment questions
What to know before choosing.
Can equipment be added to an existing car wash? +
Installation depends on available space, power supply and site configuration. Prepare a site plan and photos of the intended equipment location.
Which equipment should I start with? +
Start with customer needs and site conditions. Check which services are missing, where customers can park conveniently and who will maintain the equipment.
What should I prepare for equipment selection? +
The location, photos, dimensions of the available space and power supply information. Add the required functions, payment method and planned installation date.
Your first car wash planning meeting. What should you prepare?
From an idea to a productive discussion. Gather key information about the location, your needs and the budget — even if some answers are still “to be checked”.
The first meeting clarifies needs, location and project scope.
3starting pointsLooking for a site, have a location or comparing quotations.
6checklist itemsA practical set of information for your first consultation.
1meeting goalOne decision you want to prepare for next.
What this guide covers
To begin, you need your project stage, a location or search criteria, available documents and key questions. Below are three starting paths and a preparation checklist. You can tick off completed items as you read.
What information should you start with?
The first meeting is most useful when you know which decision it should help you make. For one person, that may be choosing a town; for another, checking a bay layout on their own site. Start by identifying your stage.
01
Looking for a site
Provide the search area, financing approach, intended site scale and timeline. We will establish criteria for comparing sites and identify information needed before choosing a location.
02
I have a location
Prepare the plot identifier, map, photos and any documents you have. The aim is to identify which options are worth considering and which unknowns need to be resolved.
03
Comparing quotations
Bring a common description of the car wash's functions and the scope of each quotation. The discussion should clarify equipment, on-site works, exclusions and responsibility for individual tasks.
Add who will make decisions and operate the site after opening. On-site management, remote management and working with a local person may require different organisational arrangements. Consider them from the first proposal.
What should a location brief contain?
Prepare one folder and a short note. Name each file so its plot and date are clear. Take photos from a driver's perspective and from within the site; listing photos alone often fail to show access properly.
How should you describe the planned car wash?
First describe customers and functions: the vehicles you want to serve, whether you plan a vacuuming area, available payment methods and who will carry out daily tasks. Then choose the direction for technology and appearance.
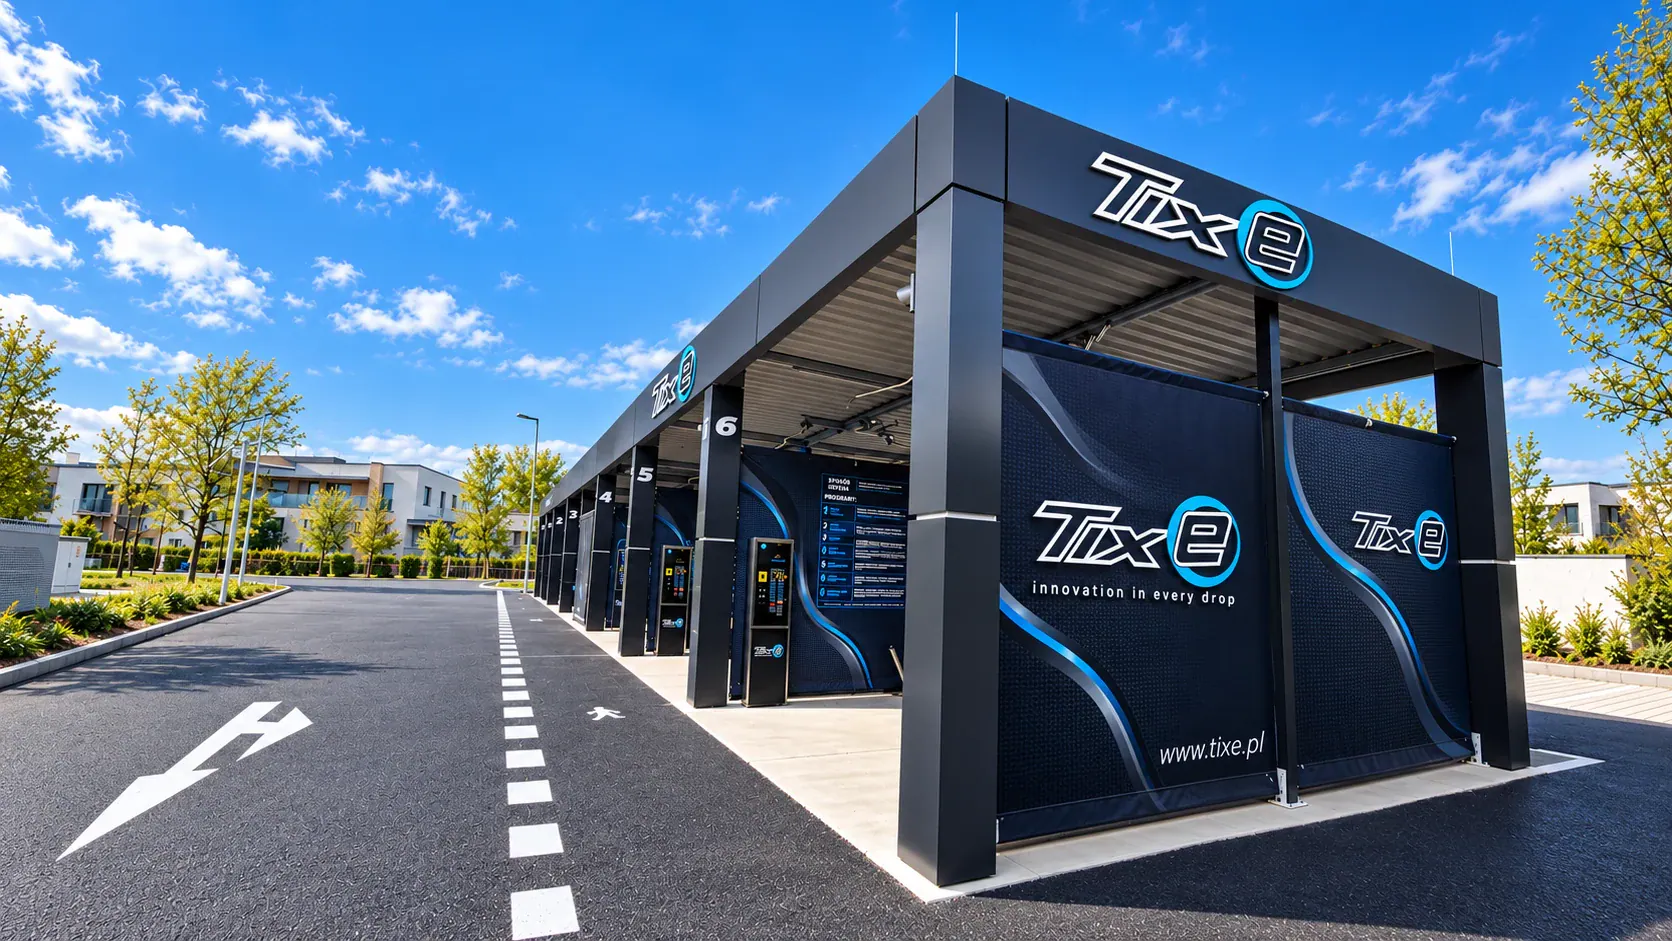
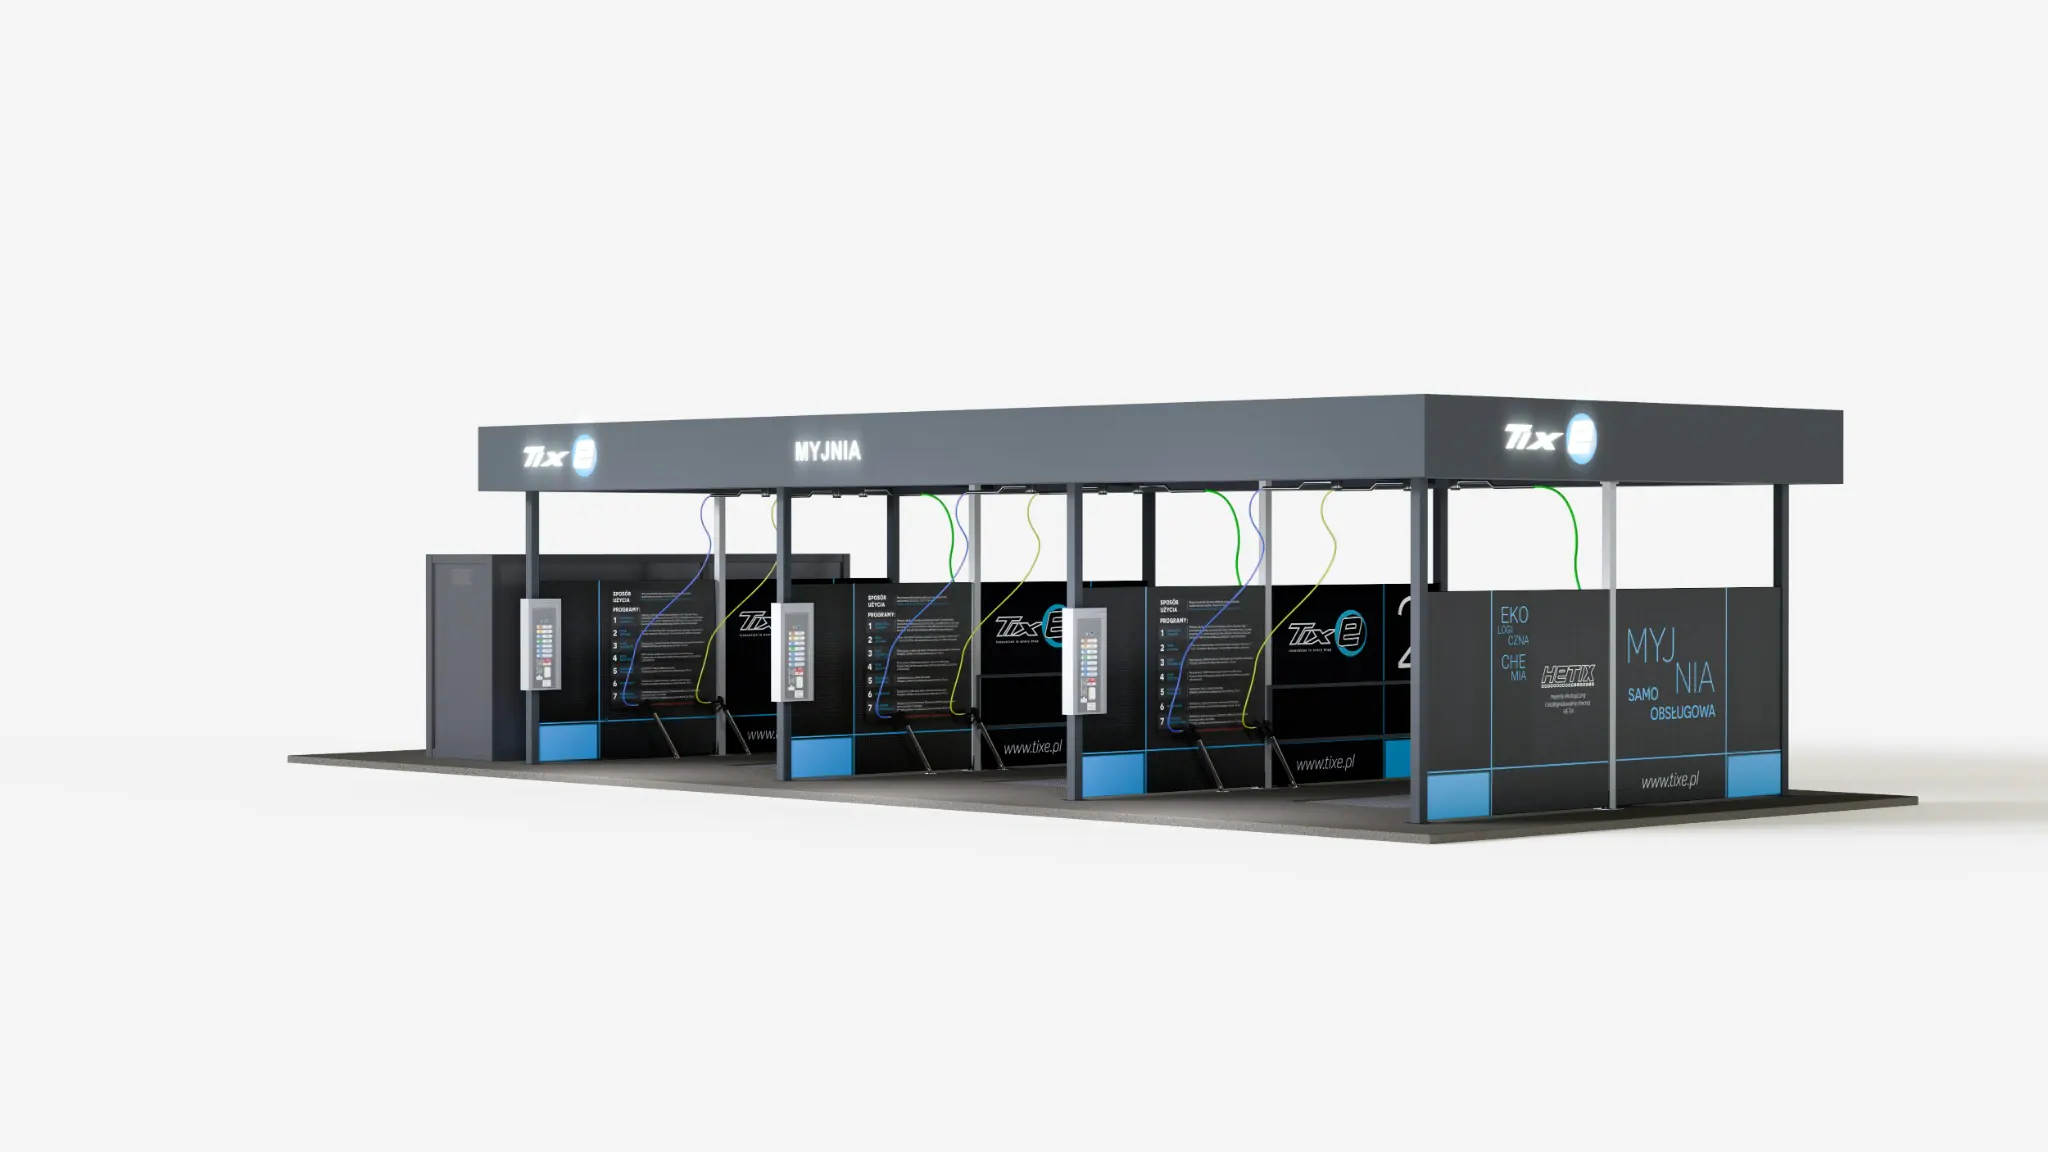
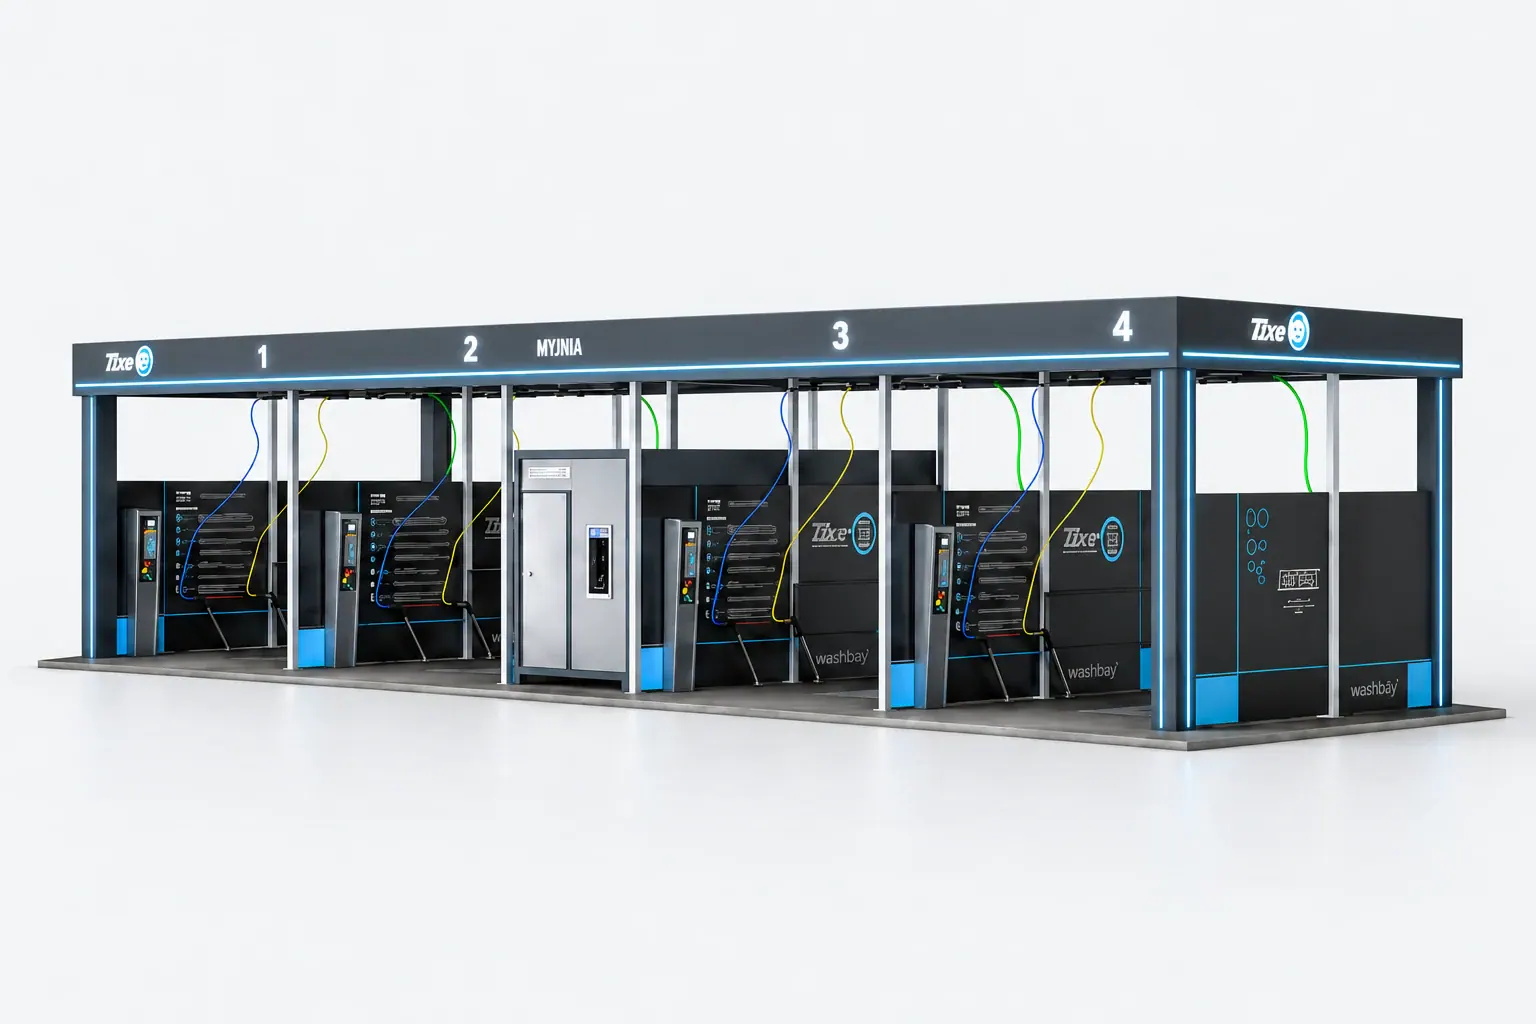
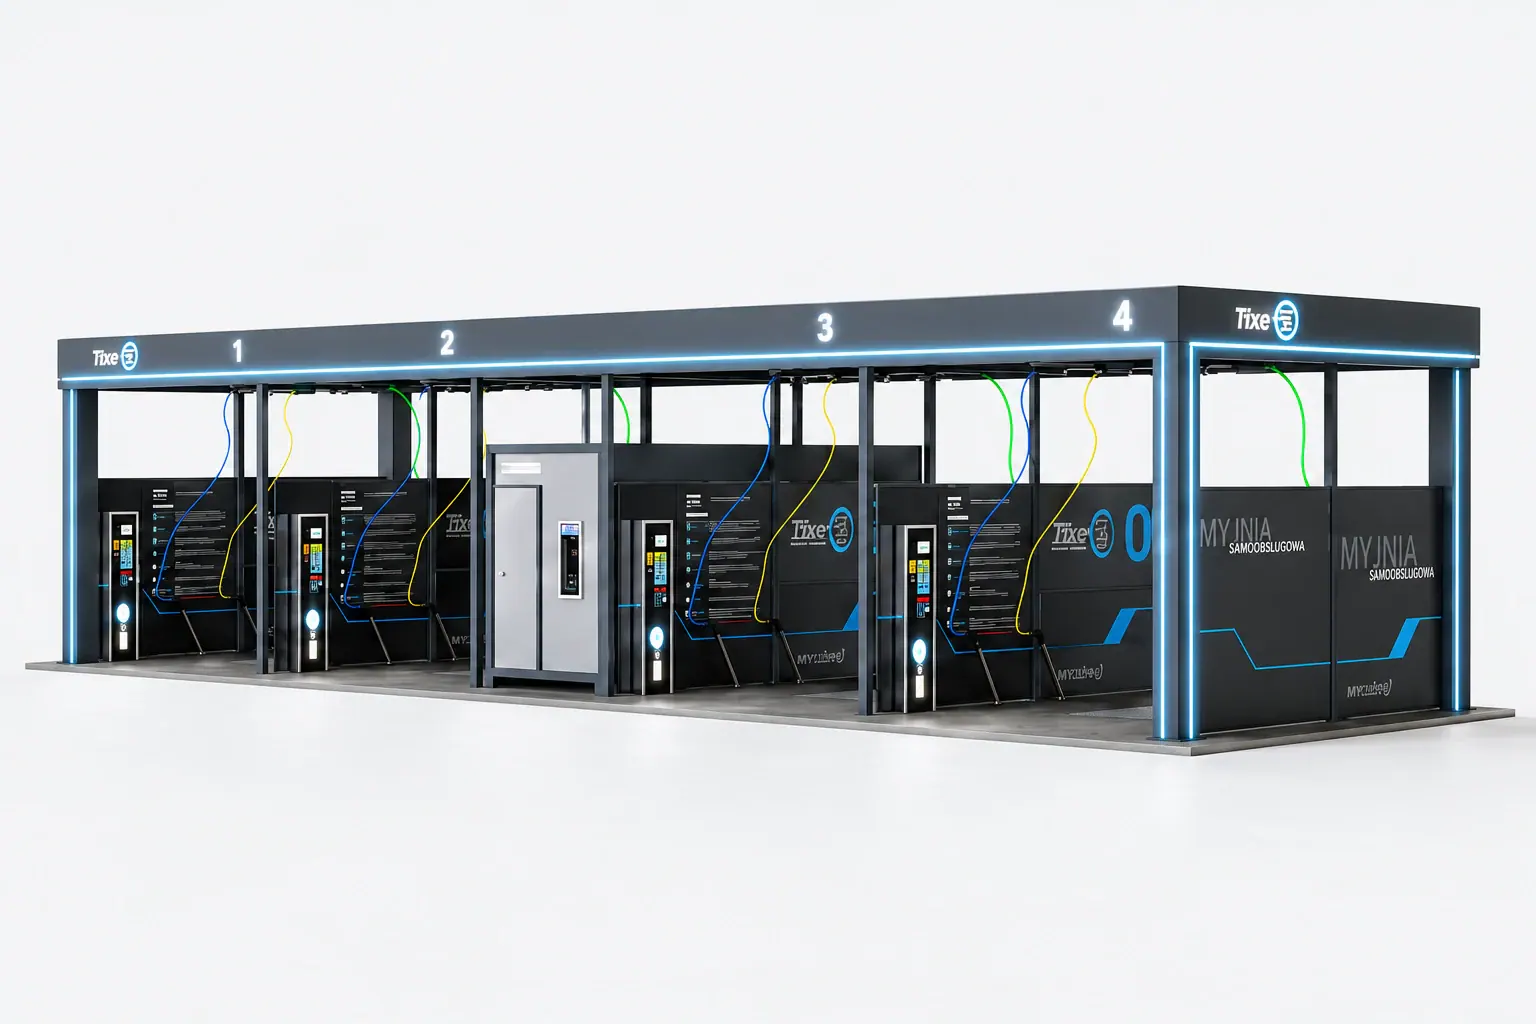
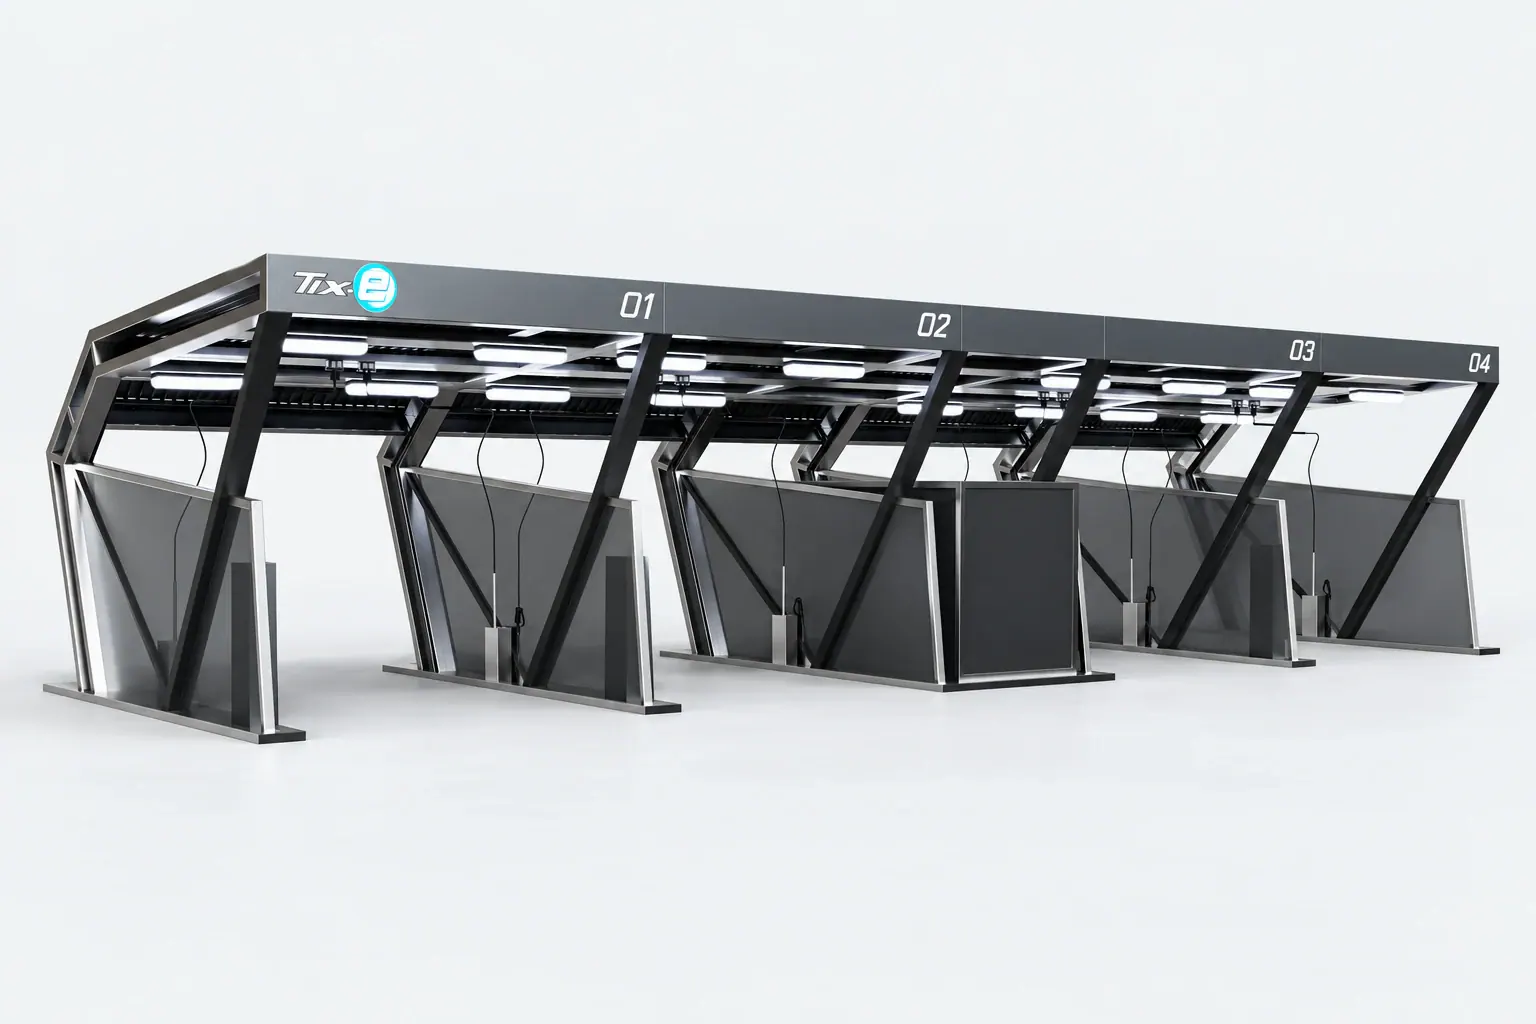
TIXE car wash. The number of bays, technical container and canopy style need to be coordinated for the location.
Divide the list into “needed for opening” and “to consider later”. For later equipment, ask about installation preparation, space and compatibility with the chosen configuration. A budget reserve does not automatically make expansion possible.
You can show a photo of a project you like and identify what appeals to you: proportions, colour, bay layout or additional equipment. That inspiration needs to be translated into a scope description. Our guide can help on combining technology and appearance.
What if you are still looking for a site?
Prepare two or three locations and describe them using the same questions. This ensures an attractive price does not overshadow difficult access, unknown connections or an impractical site shape.
The same brief for every location
Area
What to record before the meeting
Surroundings
Where customers are expected to come from and which daily routes pass nearby.
Access
Entry from both directions, visibility and known road restrictions.
Site potential
Dimensions, existing structures, utilities and documents available from the owner.
Decision factors
Price or rent, intended timeline and questions to answer before choosing.
The comparison helps select locations for more detailed analysis. Specific development potential and technical conditions are checked for the chosen site. Find a further checklist in the site selection guide.
What questions should complete your preparation?
Instead of ending the discussion with a general “please send a quotation”, agree the next step and the information needed to complete it. Every unknown should have a person responsible for resolving it and an expected response date.
Confirm the goalAre you choosing a site, a car wash configuration or a scope to price?
Record what is missingWhich document, parameter or agreement is still needed?
Assign responsibilityWho will obtain the information: the investor, designer, utility supplier or TIXE?
Agree the next stepWhat materials will you prepare and what will the next discussion cover?
FAQ
Frequently asked questions
Can I start a discussion without a site?
Yes. Specify your search area, goal and project parameters. An initial outcome may be a set of criteria for comparing available sites.
Do I need a complete design straight away?
No. Show what you already have. Preliminary materials are enough to agree the next steps, provided unconfirmed information is clearly identified.
What if I do not know my budget yet?
Explain the financing you are considering and which elements are essential. Then organise the full scope of costs: site, documentation, works, car wash, commissioning and start-up funds.
Sources and materials
TIXE's own preparation checklist. Geoportal helps identify land; detailed project decisions require documents specific to the location.
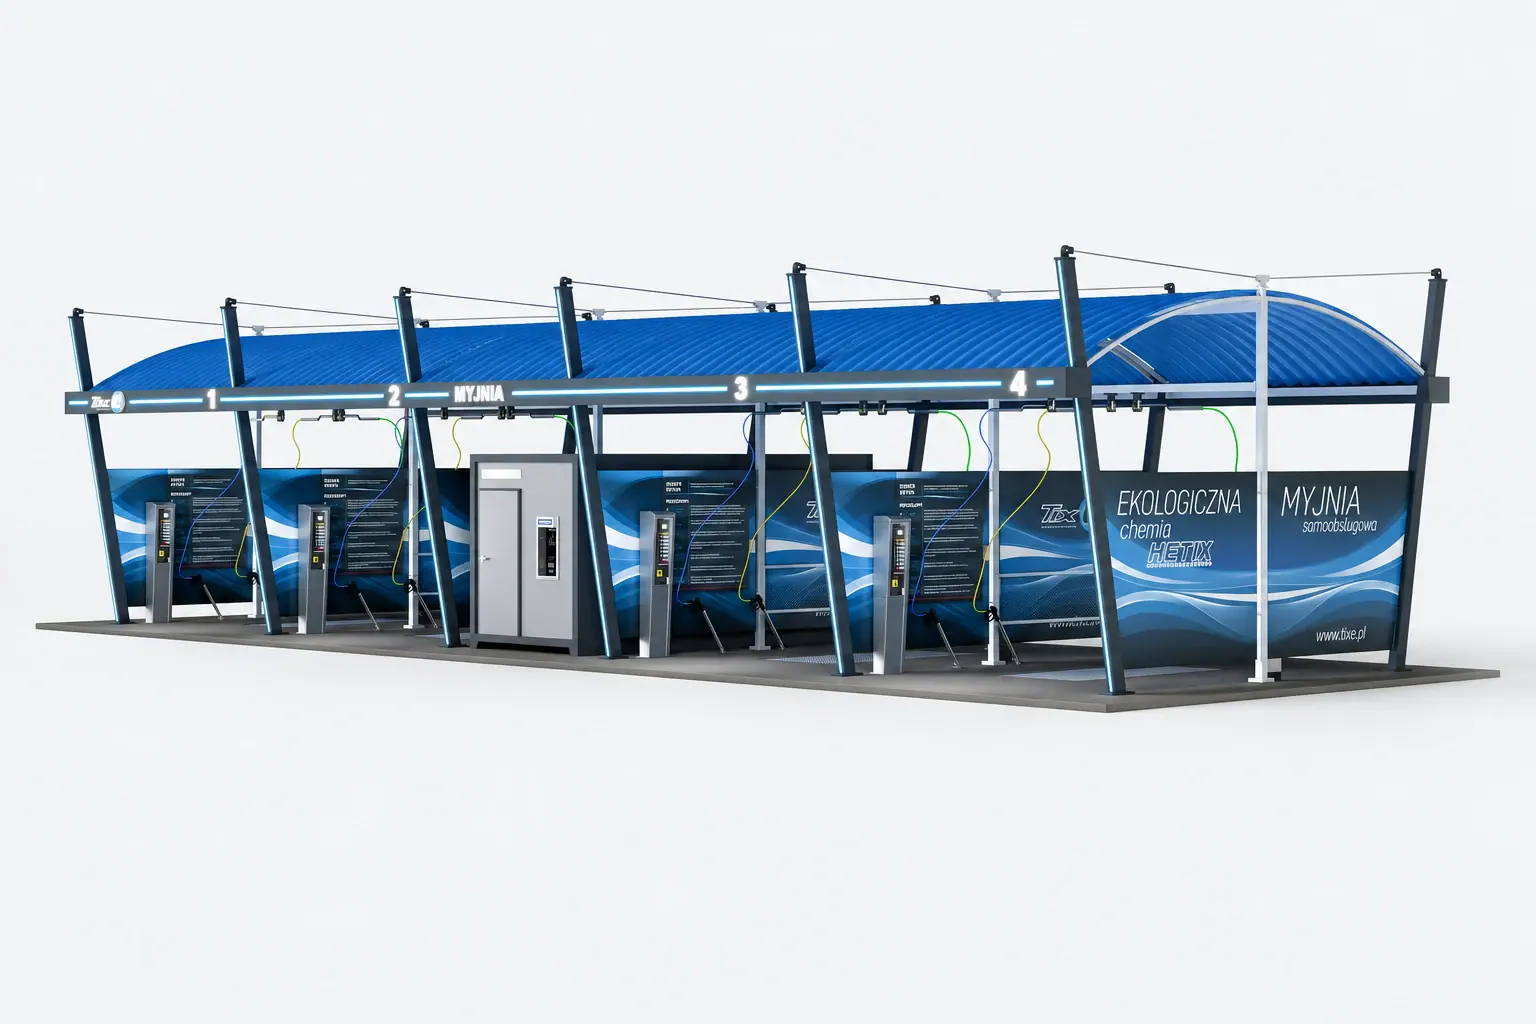
MODERNA canopies. Appearance, technology and equipment are tailored to each project.
4configuration layersTechnology, canopy style, programmes and equipment.
up to 3bays with RapidThe final number of bays is set during configuration, with no subsequent increase.
up to 6bays per Express containerFurther development must be allowed for in the design.
What this guide covers
Configure your car wash in four layers: scale and technology, canopy style, wash programmes and additional equipment. Rapid and Express describe the technology and technical container solution. SIMPLE PREMIUM and MODERNA describe the canopy style. Coordinate every choice with one site plan and one up-to-date specification.
Why define the site's function first?
Before choosing a fascia colour, describe how customers will use the car wash. A small site serving local residents has different needs from a location with large fluctuations in traffic. Bay availability, convenient payments, clear programmes and space to finish the visit comfortably all matter.
01
Operating scale
Set the number of bays for opening and the final target. Record the expected vehicle types and whether an uncovered bay is needed.
02
Customer experience
Choose programmes, payment methods and additional services. Check whether drivers can easily read the instructions and reach the function they want.
03
Daily operation
Plan access to equipment, chemical replenishment, material storage and inspections.
For each choice, mark whether it is needed at launch, requires preparation for later installation or is still under consideration. This helps select equipment without unintentionally expanding the scope.
What do the names Rapid and Express describe?
These are TIXE's two technology and technical container lines. The choice concerns space for technology, operating scale and equipment layout options. It does not replace an equipment list or the design of the whole site.
Rapid and Express — a comparison of decision areas, without specifying particular equipment.
Area
TixeRapid
TixExpress
Scale
Up to 3 bays.
Up to 6 bays with one technical container.
Technical facilities
Compact technical container for an agreed configuration.
More technical space for extensive equipment.
Development
No later increase in the number of bays; equipment upgrades require assessment.
Further expansion, container layout and spare capacity are established in the design.
Decision point
Does this solution accommodate the intended final scale and equipment?
Which functions and future development plans must be allowed for from the outset?
TixeRapid. Programmes, payments and equipment follow the agreed configuration.
If the site is intended to accommodate a larger car wash in the future, communicate this before technology selection. Spare space beside the bays alone does not confirm that additional bays can be connected.
What does the selected canopy style determine?
The canopy system gives the car wash its form: proportions, roofing, divisions and visual identity. Names such as SIMPLE PREMIUM, QUADRA and MODERNA help define a style direction. Appearance must be coordinated with the bay layout and agreed equipment.
TIXE MODERNA canopies. Construction details are agreed for each project.
Also assess how easy the site is to understand from the approach and how comfortable it is to move around. A detail that looks good close up should also work from the perspective of a driver entering the site.
How do programmes and equipment fit into the site plan?
A programme is a service selected by the driver. Technology enables it to work, while equipment affects bay operation. Map out these relationships before approving the panel and instructions.
01
Main wash + TOP GUN
The main wash uses hot, softened water with detergent at high pressure. The system can be combined with TOP GUN; parameters are selected for the configuration.
02
Brush + DOUBLE POWER
DOUBLE POWER supports the brush washing and foaming system. It should not be confused with a solution for the main wash using a lance.
A vacuum cleaner, mat washer or fluid dispenser needs space both for the equipment and the vehicle using it. Check that the additional services area does not block exits from the bays. Plan service access to the technical container in the same way.
Most misunderstandings arise when the rendering shows one version, the quotation another and the site drawing a third. Apply every significant change across all materials.
Function listWhat must work at opening and what preparation is needed for later.
A coordinated versionThe same number of bays, container location and equipment set in the plan and quotation.
Version for approvalDate, version number, change list and resolved technical questions.
Before approval, ask for the supply scope to be separated from work arranged by the investor. Assign an owner and a deadline to every “to be confirmed” item. In the car wash planner you can organise your preferences for discussion; compatibility of the selected set is confirmed through technical selection.
FAQ
Frequently asked questions
Do Rapid and Express describe the appearance of the car wash?
They are technology and technical container lines. Appearance is described by separate canopy names, while equipment follows the specific specification.
Can a car wash be prepared for additional equipment later?
Raise this requirement at the outset. Available space, power supply, installations and control compatibility must be checked for the planned equipment.
Does the price of every car wash shown in a photo include all visible options?
The quotation confirms the scope. A photo or rendering helps define expectations but is not a list of supplied items.
Sources and materials
Prepared using current product and wash programme descriptions on the TIXE website. Dimensions, equipment compatibility and development options are confirmed by the documentation for the selected configuration.
Upgrading a car wash. From identifying the problem to checking the result.
Payments, technology, appearance or an additional services area? A good upgrade plan combines a specific goal with an assessment of the existing installation and organised works.
Zabrze after an appearance upgrade — canopy detail. Photo from TIXE materials.
3component decisionsKeep, repair or replace.
4areas to assessTechnology, utilities, customer service and appearance.
2reference periodsBefore and after the change, with operating conditions recorded.
What this guide covers
First describe the problem and gather data. Then separate items to keep, repair and replace. Agree new equipment compatibility, phasing and acceptance checks. Assess the result against a criterion set before work starts — from payment reliability to consumption relative to car wash activity.
Where should an upgrade begin?
Instead of saying “the car wash needs changes”, record an observation: the terminal interrupts transactions, a bay repeatedly needs servicing, customers do not understand the instructions or water consumption is growing faster than usage. Each problem calls for a different scope of work.
01
Operational continuity
List faults, their frequency and bay downtime. Establish what requires urgent diagnosis.
02
Customer convenience
Assess payments, panel clarity, signage and additional services. Consider the entire visit, from entry to exit.
03
Costs and appearance
Separate utility consumption from utility prices. Describe the condition of canopies, lighting and branding separately.
Choose the goal for the first stage. It may be eliminating a recurring fault or introducing a particular payment method. This makes it easier to establish what must be included and what can wait.
What information should you prepare for assessment?
An exterior photo shows appearance but does not explain how the installation is built. For an initial discussion, you need a view of the bays, technical container and equipment, together with the problem history. Record symptoms without guessing their cause.
Zabrze during the works — between the previous appearance and the new identity.
If documentation is missing, state this in your request. An on-site installation assessment may be the first task. Data prepared using this list enables the TIXE team to ask more relevant questions before the visit.
What should be kept, repaired or replaced?
Equipment age alone should not determine replacement. Its condition, serviceability and compatibility with the planned solution matter. Payment changes require checking the connection to the controls; new technology requires checking its space and installation needs.
Three decisions for every upgrade area.
Decision
What to establish
What to include in the scope
Keep
Is the component functional and compatible with the planned change?
Confirmation of the assessment and any preparatory actions.
Repair
Do we know the cause of the problem and how to resolve it?
Parts, work and the criterion for checking the repair.
Replace / add
What requirements must the existing installation meet?
Equipment, connections, controls and associated work.
Zabrze — before the change.Zabrze — after the appearance upgrade.
When choosing new programmes, keep the correct relationships in mind: TOP GUN relates to the main wash, while DOUBLE POWER relates to the brush system. Compatibility is confirmed individually.
How should car wash operation be planned during changes?
Phasing is agreed after shared installations have been checked. Work on one bay may affect others if they use the same supply or control system. Site availability during the upgrade should follow the work plan.
PreparationConfirm deliveries, access to the technical container, the work scope and the coordinator.
Works and shutdownsAgree dates, bays unavailable to customers and protection of the work area.
CommissioningCheck the agreed functions, payments and instructions, and record the results at acceptance.
Prepare a clear notice for customers. After changing panels or programmes, give operators updated instructions. Update the documentation with installed equipment and changed settings; it will be needed at future inspections.
How can the effect of an upgrade be checked?
Set the criterion before work starts. For faults, use the number of similar incidents and downtime. For payments, check the agreed operating scenarios. For water management, compare readings against comparable car wash activity.
Keep pre-change readings, the commissioning date and data from the following period. Add weather, downtime, utility prices and programme changes. If several factors changed, do not attribute the entire result to one device.
Does an upgrade require replacing all the technology?
The scope follows the site assessment. Functional, compatible components can be retained, with work focused on the identified need.
Does TIXE also upgrade car washes made by other manufacturers?
Yes. Selecting a solution requires assessing the specific installation, its documentation and integration options.
Can all bays be guaranteed to remain operational during changes?
Availability is agreed after assessing the scope and shared installations. The schedule must identify required shutdowns and restart conditions.
Sources and materials
Photos come from TIXE presentation materials. EPA guidance was used in the section on measurement; it does not verify the performance of specific TIXE equipment.
NETCONNECT — TIXE remote monitoring. Available data depends on the installation configuration.
3separate columnsQuantity, unit price and total value.
2comparable periodsReadings with operating conditions described.
1consistent unit of activityFor example, active wash minutes from a reliable report.
What this guide covers
Compare the same periods and units. Collect consumption, rates, chemical stocks and car wash usage data. An indicator related to site activity explains change better than an invoice alone. Assign a date and baseline to every upgrade.
How can costs be compared between periods?
Choose a common start and end date for the comparison. Gather water and electricity readings, chemical consumption, operating costs and bay activity data. An invoice issued in March may cover a different period from the March payment report — note this difference before calculating.
01
The same scope
Compare the whole site with the whole site, or the same defined process. Do not mix a main meter reading with a measurement from one piece of equipment.
02
The same unit
Record m³, kWh, kg or litres. Collect activity data using one agreed unit and the same source.
03
Operating conditions
Add the number of available bays, downtime, season and dates of setting changes. Without this, the figures may tell an incomplete story.
A payment does not always mean one customer or one wash. A driver may top up several times. If you do not have a reliable visit count, use available active wash minutes and label the indicator clearly.
Why separate consumption from price?
A bill is affected by both the amount consumed and the rate. Fixed charges need a separate entry. First examine consumption changes, then price changes, and only then compare total values.
Variable cost = consumption × unit rate
Add fixed charges and other bill components separately, based on your own billing.
If the main meter also covers cleaning, water preparation or installation protection, the result describes whole-site consumption relative to operating minutes. It is not the flow rate from a single lance. Keep the same measurement boundary in both periods.
What simple records should you keep?
A clear spreadsheet updated on a consistent schedule is enough. Record each entry's source: meter, invoice, controller report or stock count. Distinguish actual readings from estimates.
Two-period worksheet — fields to complete with your own site data.
Item
Period A
Period B
What to check
Dates and availability
From–to, operating days
From–to, operating days
Are the duration and number of operating bays comparable?
Water / electricity
Start and end readings
Start and end readings
The same measurement boundary and unit.
Chemicals
Opening stock + deliveries − closing stock
Opening stock + deliveries − closing stock
Separate entries for products, without mixing kg and litres.
Car wash activity
Reliable activity report
The same activity report
The same definition of minutes, cycles or visits.
Costs
Rates, charges, servicing
Rates, charges, servicing
Separate purchases, consumption and one-off events.
Changes
Notes on conditions
Notes on conditions
Weather, faults, new programmes and settings.
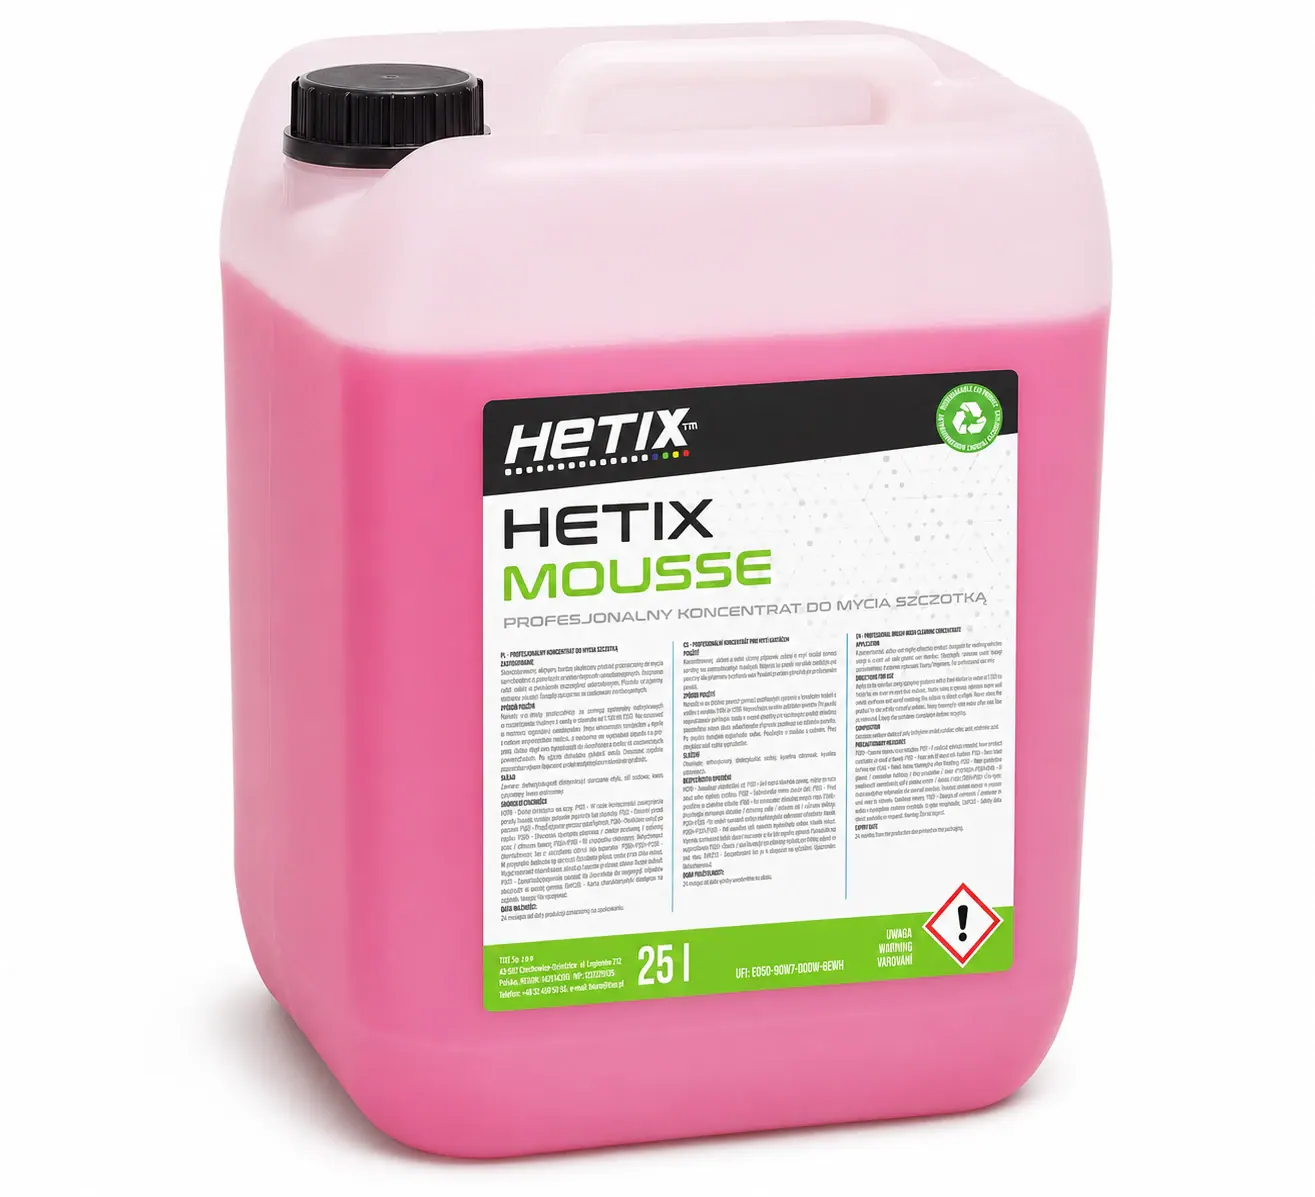
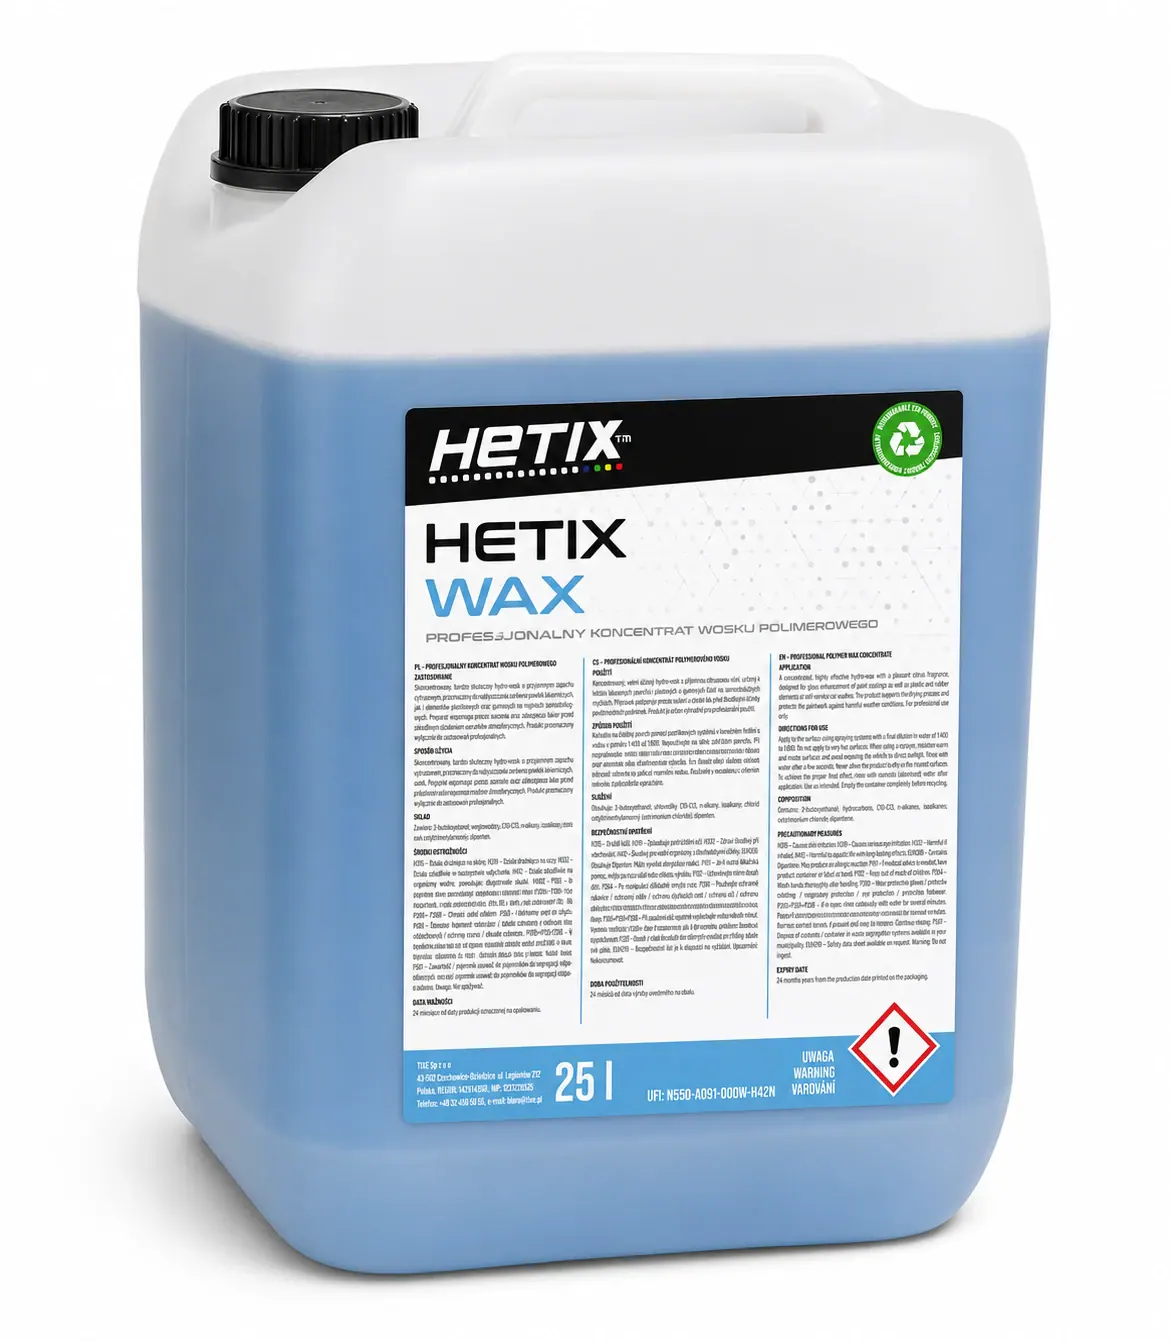
HETIX chemicals: keep a separate record for each product.
For chemicals, start with a stock balance: opening stock plus deliveries minus closing stock. Separate spills, returns and transfers to other sites. A large purchase at the end of the month may increase expenditure without increasing consumption in the period analysed.
What context makes a comparison meaningful?
A change log is as important as a meter reading. Different weather can affect traffic and heating demand, while downtime reduces bay use. Adding a programme changes the mix of services used. This context needs to appear alongside the result.
Unusual water use is worth investigating. A moving meter when no customers are present does not prove a leak: first account for scheduled automatic processes. Report the symptoms and when they occur to the service team.
How can the effect of a change be assessed?
Record the hypothesis before implementation: what should improve, how it will be measured and what the result will be compared against. After the change, use the same indicator definition. Also assess service quality and reliability so reducing consumption does not become the only goal.
Before the changeKeep readings, activity reports, settings and descriptions of conditions.
ImplementationRecord the date, scope and any other changes made at the same time.
After the changeCompare quantities, rates, the activity indicator and service performance.
If conditions differ substantially, treat the result as a reason for further observation. Linking an upgrade to an outcome requires more than comparing two amounts. The data collected will help when planning an upgrade and discussing water management.
FAQ
Frequently asked questions
Can every transaction be treated as one wash?
Not always. Top-ups and different payment methods may create several transactions during one visit. Define the indicator based on the available report.
Are invoices enough to assess chemical consumption?
You also need to account for stock levels and other material movements. A purchase does not equal consumption.
Does a lower unit cost confirm the overall profitability of an upgrade?
It is only one part of the assessment. Investment expenditure, servicing, site availability and service quality must be considered separately.
Sources and materials
The water monitoring approach was cross-checked against EPA materials. The worksheet and two-period example are original educational material. The example figures do not describe the performance or savings of any particular car wash.
Make an initial selection of bay count, canopy style and self-service car wash equipment. Prepare a summary of your choices for a discussion with the TIXE team.
01 / 06 · Scale
The configuration is a starting point for discussion. Layout, colours and technical possibilities will be confirmed in the design.
Completed project
Tabor (Czechia) — 8 bays
Eight wash bays, MODERNA canopies and an area for additional equipment.
How to compare car wash quotations? Scope first, then price.
Two similar renderings can represent very different supply scopes. Organise technology, works and responsibilities in one table before comparing the final amounts.
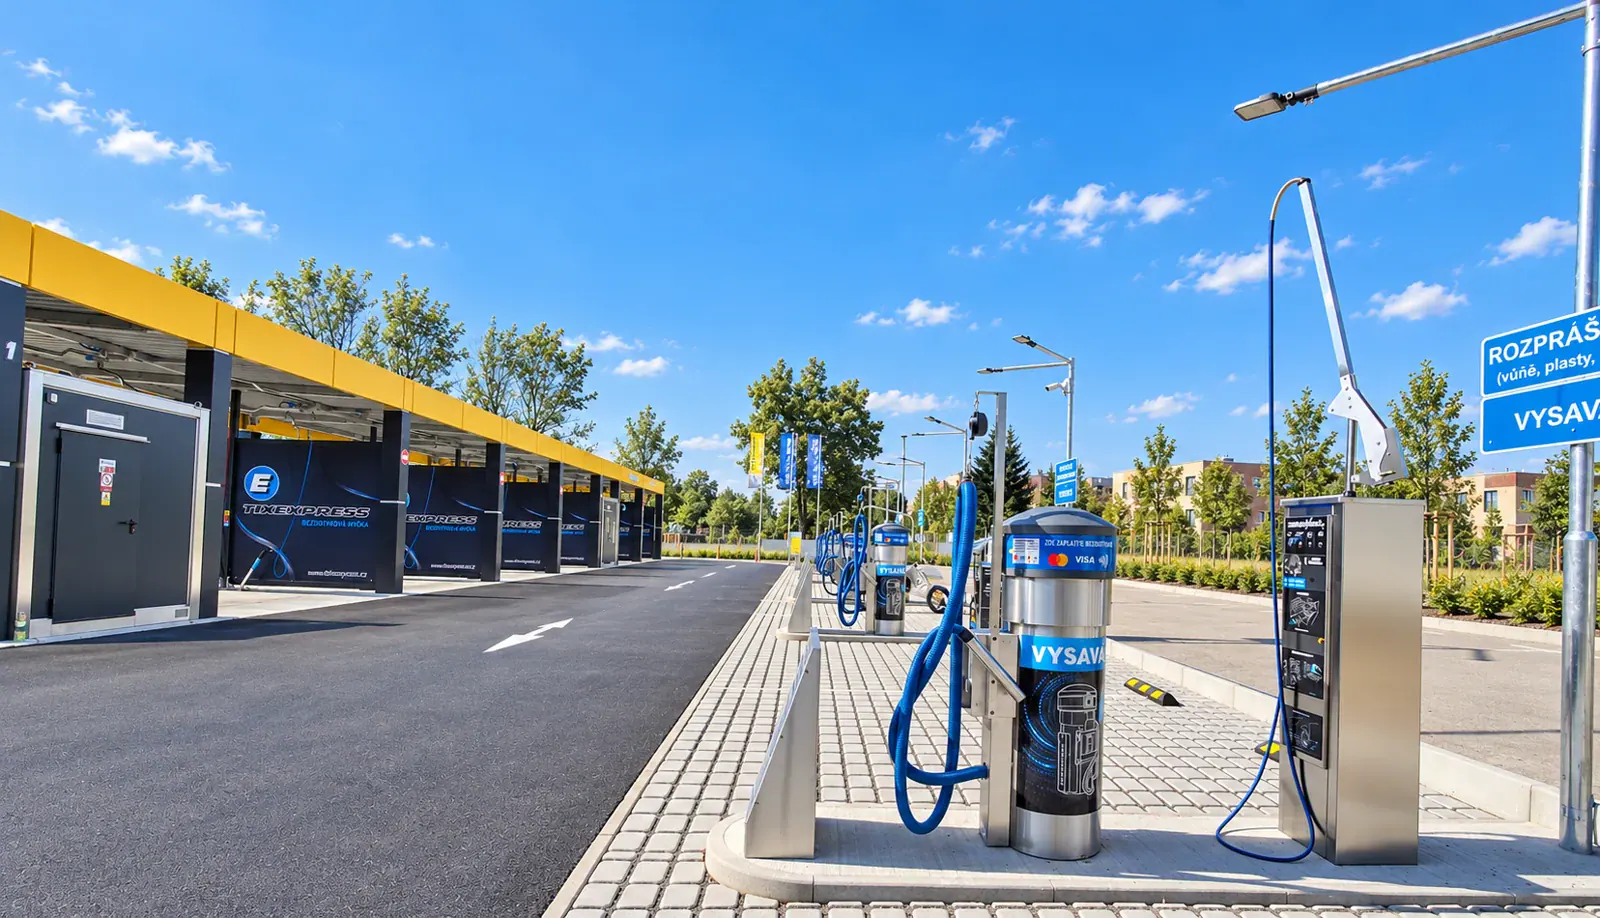
A completed site brings together canopies, technology, equipment and site development.
8comparison groupsFrom technology to commissioning and maintenance.
3statuses for each itemIncluded · optional · excluded.
1agreed versionThe quotation, equipment list and plan describe the same site.
What this guide covers
Compare the same car wash configuration, with the same bay count and equipment scope. Mark each item as included, optional or excluded. Then add works and purchases arranged by the investor. The technology price is one part of the overall project budget.
Establish a common baseline
Prepare a short project brief: location, number of bays, anticipated expansion, selected programmes, payment methods and additional services. Also record what you do not yet know. Missing utility connection data should appear in the comparison as an issue to resolve.
01
Technology
Rapid or Express, number of bays supported, water treatment, heating and controls.
02
Canopy style
Selected structure, finish, visual identity and lighting included in the quotation.
03
Equipment
Wash programmes, terminals, vacuum cleaners and other equipment, including quantities.
Rapid is a line for up to 3 bays, with no subsequent increase in their number. Discuss Express for a larger scale or planned expansion. Choose the canopy style separately, such as SIMPLE PREMIUM or MODERNA. These names describe different parts of the project.
Compare eight scope categories
The matrix below shows what to ask about. It does not define TIXE's standard supply scope. For each item, record the agreement in the specific quotation, quantity, amount and contractor. An empty field means a question remains to be answered.
Scope
Confirm what is included
Check options and exclusions
Assign responsibility
Technology and technical container
Line, number of bays, equipment and controls.
Additional systems and preparation for expansion.
Delivery, positioning and maintenance access.
Canopies and signage
Structure, cladding, logos and lighting.
Changes to materials, colours and details.
Appearance approval and installation.
Flooring and site
Precisely specified flooring components.
Sub-base, earthworks, roads and paved areas.
Ground preparation and execution of works.
Utilities and drainage
Connection boundaries of the car wash installations.
Utility connections, on-site networks and external equipment.
Design, construction and utility readiness.
Programmes and water
Programmes, lances, brushes and water treatment system.
Extensions and additional water solutions.
Selection according to water quality and commissioning.
Payments and additional services area
Types and quantities of terminals and equipment.
Operator fees, connectivity and additional functions.
Agreements, activation and bay preparation.
Transport and commissioning
Delivery, installation, testing and training.
Unloading, lifting equipment and additional visits.
Site organisation and conditions for starting work.
Documentation and maintenance
Technical materials, manuals and warranty terms.
Design, inspections and additional services.
Document handover and maintenance plan.
Separate the supply price from the project budget
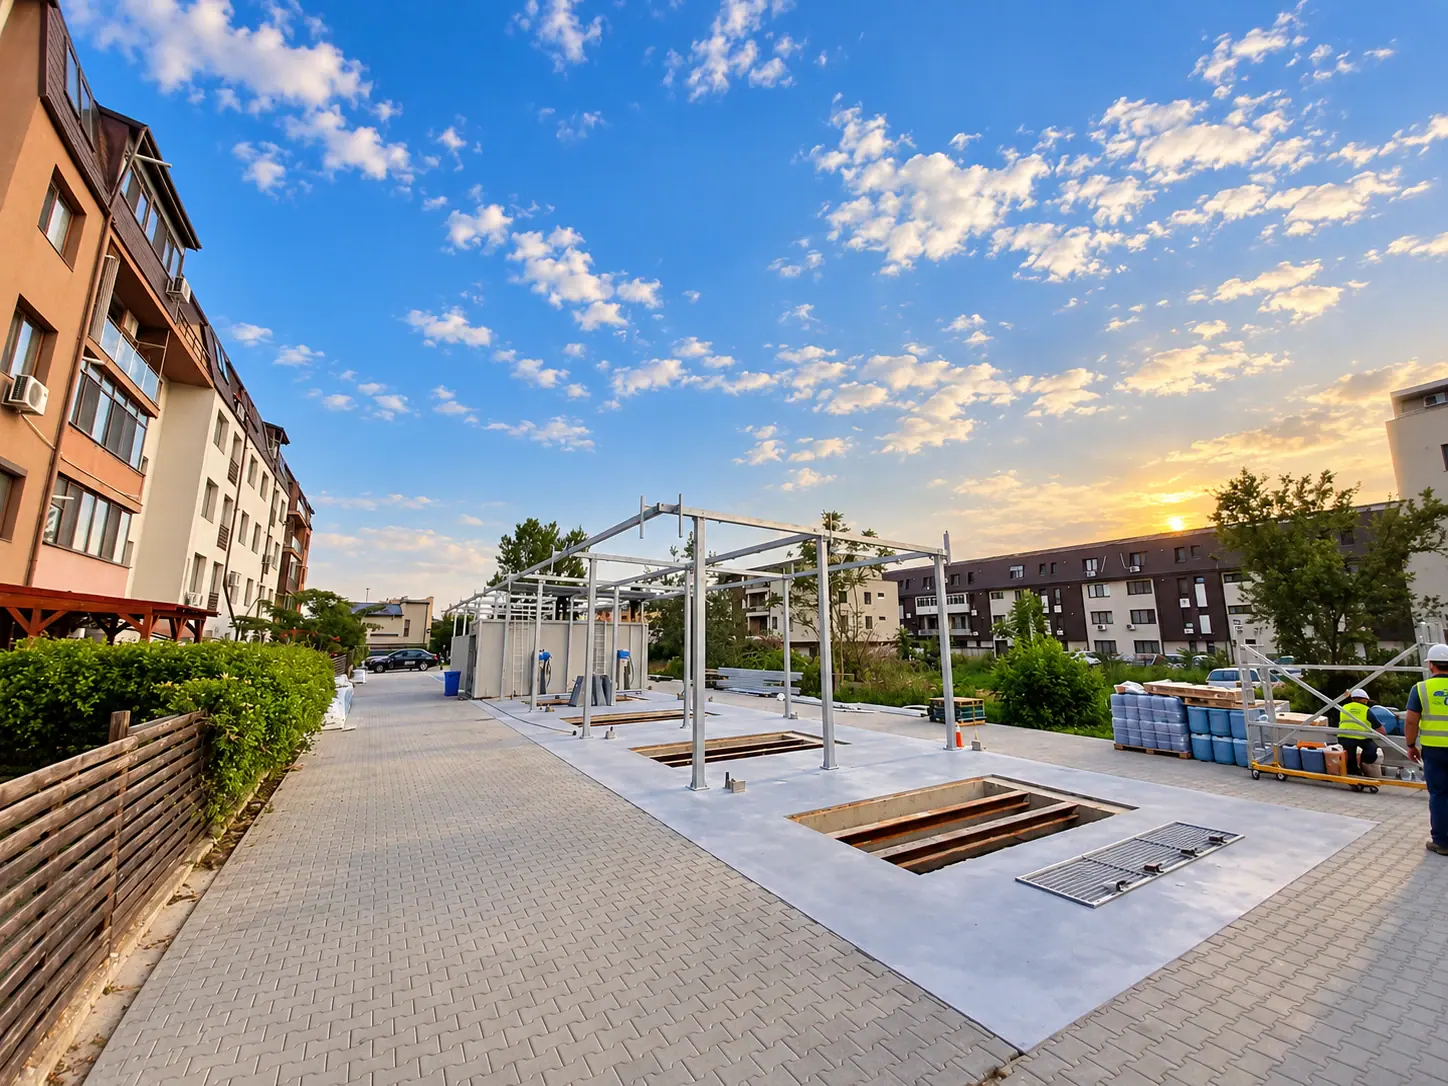
Bucharest during canopy installation. When comparing quotations, also agree the scope and organisation of work.
Adding up equipment costs does not complete the budget. Include the site or access to it, studies, ground preparation, utility connections, works, transport and business start-up. Count items already included in the supply only once. Contractors' scopes should meet at clearly defined boundaries.
Project budget
Agreed supply + works outside the supply scope + preparation and start-up costs + a reserve for identified risks.
Compare amounts in the same currency and on the same net or gross basis. Record the exchange rate used for foreign-currency items. Check payment dates, price validity and events that determine the schedule. Set the contingency according to unresolved matters, such as ground conditions or utility connection routes.
Beyond the equipment price, establish supported payments, operator terms, connectivity and integration. These answers help prepare a working service for customers.
Assess claimed savings in the same way: ask which process they concern, which configuration was used for comparison and under what conditions. A single percentage without a baseline does not explain your car wash's future bills.
Consolidate agreements into one version
Fill the gapsCollect answers for empty fields and discrepancies.
Calculate the full amountAdd the options needed for your planned operating model.
Confirm the versionAgree the quotation date, equipment list and current site layout.
For example, adding a vacuum cleaner also requires space for the car, a power supply and installation arrangements. Adding a bay requires technology and site layout to be checked again. Update all related documents after such changes.
The comparison should produce a short list: what you are buying, what you are responsible for, what still needs pricing and which decisions remain open. With this summary, discussing price becomes a discussion about a specific project.
FAQ
Frequently asked questions
Does the lowest technology price mean the lowest project cost?
The total of comparable scopes determines this. Add required options and the investor's works and purchases to the supply price.
Does a project photo confirm the equipment included in a quotation?
A photo helps establish the desired result. Equipment and quantities are confirmed by the current specification of the particular quotation.
What if some costs are still unknown?
Mark them as awaiting a quotation, assign someone to establish them and set a response date. Do not enter zero in place of a missing amount.
Sources and materials
TIXE's original working matrix, based on its product range and investor journey. The actual supply scope, exclusions, price and parties' responsibilities follow the agreed quotation and contract.
Water at a car wash. Osmosis, recovery and retention explained clearly.
Final rinse water, reverse osmosis reject water and wastewater from the bays have different properties. See how to organise the water cycle and discuss savings based on measurements.
3water streams to distinguishRO reject water, process wastewater and rainwater require separate decisions.
2questions before recoveryWhere does the water come from, and what will it be reused for?
1common measurement periodMeter readings, car wash activity and costs are compared over the same days.
What this guide covers
Three different water streams, the roles of TIXE technologies and a list of data needed before changing the installation.
First identify the water you want to use.
“Water recovery” can refer to different installations. Before selecting equipment, draw a simple map: source, tank, treatment and point of use. This makes it easier to assess what actually returns to use and what is only stored temporarily.
01
Reverse osmosis reject water
Produced when water is treated through RO membranes. It is separate from water running off a washed vehicle. Any further use must be selected according to water quality and site requirements.
02
Process wastewater
Runs off the bays carrying dirt and cleaning product residues. Reuse requires a treatment system suited to this water stream and identification of the programmes to which the water can return.
03
Rainwater
Comes from precipitation. Retention means storing it; using it in an installation is a separate task. The collection area, treatment method and intended use must be established.
Treatment prepares water for a specific task.
In the TIXE range, WATER PERFECT CLEAN combines filtration, softening and reverse osmosis. These stages address different water characteristics: preparing it for the system, compatibility with chemicals and final rinsing to reduce mineral marks.
Incoming waterIdentifying parameters and installation requirements.
PreparationFiltration and softening according to the configuration.
Reverse osmosisPreparing water for the final rinse; reject water is also produced.
Appropriate point of useA wash programme or a separately selected auxiliary application.
The diagram shows the role of each stage, not the hydraulic design of a specific car wash. Do not determine osmosis operating ratios solely from tank capacity. Prepare water test results, equipment model and production and reject readings, where available, for your discussion with a technician.
AQUARIUS and CYCLO-BOOSTER have different roles.
AQUARIUS · use of RO reject water.
Solution
Where does the water come from?
What is it for?
AQUARIUS
Reject water from reverse osmosis.
Reuse for auxiliary applications, such as cleaning the site.
CYCLO-BOOSTER
Process wastewater from the car wash.
Treatment and preparation of recovered water for reuse.
AQUARIUS enables use of a specific water stream generated by reverse osmosis. CYCLO-BOOSTER concerns a different water cycle and is presented by TIXE as a completed project being prepared for implementation. Suitability and the scope of integration are agreed for each site.
When comparing solutions, ask about outlet water quality, permitted uses, maintenance, consumables and space requirements. The number of litres recovered by a device alone does not describe the car wash's full water balance.
Calculate savings at the boundary of the whole site.
Establish which result you want to improve: fresh water intake, wastewater discharge volume, cost or installation availability. Each indicator answers a different question. Operational assessment also requires data on car wash activity.
Water consumption indicator
Fresh water intake during the period ÷ number of recorded washes in the same period.
If the system does not reliably count visits, do not treat every payment as a separate vehicle. You can compare consumption with programme operating time, stating how the indicator is constructed. Add cleaning, winter protection, equipment flushing and unusual events.
Include the energy, servicing and materials needed to operate the additional system in the costs. A method for comparing periods is provided in the operating costs guide.
Prepare the data before choosing a solution.
The EPA WaterSense guide emphasises leak control and matching treatment to the intended use. It also does not recommend routinely retrofitting self-service car washes with wastewater recovery, citing risks including contaminants introduced into the bays. This is an important reason to design such a solution individually and check its operating conditions.
CYCLO-BOOSTER · project being prepared for implementation.
With this information prepared, the discussion can focus on your site: water quantity and quality, available space, maintenance and expected results. The scope of further measurements and the sequence of works can then be agreed.
FAQ
Frequently asked questions
Is reverse osmosis reject water the same as wastewater from washing cars?
No. Reject water is produced during water preparation in the RO system, while process wastewater flows from the bays. AQUARIUS and CYCLO-BOOSTER therefore serve different purposes.
Is recovery always worthwhile at an existing car wash?
It requires an individual assessment of water quantity and quality, space, integration and maintenance costs. First establish the current water balance and resolve confirmed irregularities.
Can rainwater be used directly in every programme?
Its application must match its quality and the installation requirements. Retention alone does not prepare water for the final rinse or replace a water treatment design.
Sources and materials
Prepared by TIXE. EPA is a source of general water management principles and retrofit limitations; it does not assess or recommend TIXE products. The diagrams in this guide explain the process and do not replace an installation design.
Daily car wash operation. Checks, winter and contacting service support.
A well-functioning bay starts with regular observation. Organise site walk-throughs, readings and service requests to identify changes in car wash operation sooner.
TIXE service supports owners with inspections, repairs and maintenance planning.
6walk-through areasFrom bays to payments and surroundings.
5parts of a service requestLocation, equipment, symptom, timing and contact.
1site logReadings, observations and completed tasks together.
What this guide covers
Separate routine operation from technical inspection. Record observations with the date, bay and operating conditions. Before winter, check installation protection and floor heating with the service team. Describe symptoms and attach photos to a request — diagnosis will be based on data from the specific site.
Start the walk-through from the driver's perspective
Follow the customer's route from entrance to exit. Check that they can select a programme, pay and use the equipment comfortably. Then inspect maintenance areas. Adapt inspection frequency to traffic, weather and equipment instructions; the checklist below organises the walk-through.
Visible damage to hoses, guards, holders and bristles; how equipment is stored after use.
03
Programmes
Function availability, clear descriptions, new messages and reported changes in wash quality.
04
Payments
Terminal messages, availability of selected payment methods and the condition of customer-operated components.
05
Supplies
Chemical and consumable levels, labels and stock to replenish according to instructions.
06
Surroundings
Lighting, bins, vacuum cleaners, access routes and access for operators or service personnel.
Record a fault immediately: bay, component and observed symptom. If equipment is damaged or its use raises concerns, restrict access according to the site's procedure and contact the service team.
A reading needs context
Record water and electricity meter readings with the date and time. Add information on traffic, operational bays, weather and work carried out on site. A reading covering a busy weekend is difficult to compare with a short, quiet period.
Period consumption = closing reading − opening reading
Compare the same meter, unit and time boundaries. Record conditions that affected the installation's operation.
EPA WaterSense identifies whole-site and selected-process measurement as tools for detecting changes and assessing improvements. Plan additional measurement where it can answer a specific question, such as water preparation's share of consumption.
What to know
An empty car wash may still use water
Depending on the configuration, water preparation, regeneration or winter protection may be running. Flow outside wash times needs to be compared with normal installation operation. Do not switch off frost protection simply to stop the meter moving.
If consumption rises without explanation, record times, messages and visible signs of leaks. EPA recommends combining installation observation with consumption monitoring. Share the data with the service team; do not randomly change process settings to “adjust” the result.
Preparing for winter covers two areas
Regular walk-throughs cover the panel, accessories and bay area — before the season and during daily operation.
In TIXE solutions, ANTI-FREEZE supports wash system protection, while IHS controls floor heating based on readings from sensors in the slab. These are different tasks. Having one solution does not replace a pre-season assessment of the whole site.
The TIXE inspection checklist covers the winter system, freezing point of the heating circuit fluid, water temperature and leaks downstream of the boiler, among other items. Measurements, burner maintenance and installation work are carried out by appropriately trained operators or service personnel. Timing and scope depend on the documentation and equipment condition.
A service request that enables diagnosis to begin
Instead of simply saying “it does not work”, provide five brief pieces of information. You do not need to identify the cause. A precise symptom description helps determine the next steps.
LocationCar wash address, customer number and bay number.
EquipmentModel, serial number or a photo of the accessible identification plate.
SymptomWhat happens and during which programme; the exact message text.
TimingWhen the problem started, whether it is continuous and what preceded it.
ContactPhone number for the person on site, photos or a short video of the symptom.
Example description
Bay 2 · final rinse
“Since the morning walk-through, the jet has been noticeably weaker. The other programmes work as before. Panel message: … . A photo and short video are attached. … is on site, phone …”.
Before taking a photo, do not remove covers that require authorised access or operate damaged equipment for demonstration purposes. For an out-of-warranty service request, also provide your service agreement number if you have one.
An inspection leaves useful knowledge for the months ahead
When ordering parts, it helps to identify the equipment and describe the component using its service history.
Keep inspection sheets, operating-hour readings, a list of replaced parts and recommendations. A single log helps link a customer report to a change in consumption, a chemical delivery or an earlier repair.
After an inspection, establish what was done, what needs monitoring and what comes next. A recurring symptom may indicate a need for a wider assessment of the system. The site's history also helps define the scope of an upgrade.
Downloadable material
TIXE inspection sheet
This document records completed tasks and observations. The scope of work is tailored to the equipment at each car wash.
How often should a technical inspection be carried out?
Set the timing and scope based on the manuals, warranty conditions, operating hours and condition of the car wash. Routine walk-round checks do not replace a technical inspection.
Does water flow when the bays are empty indicate a fault?
It may result from scheduled system operation. Compare the reading with the configuration, weather and active processes. Report unexplained or new consumption for investigation.
Is the PDF sheet a DIY repair manual?
It is a document for recording inspection tasks and observations. Equipment documentation defines how work should be carried out, the qualifications required and operating procedures.
Sources and materials
The organisational recommendations are based on TIXE service materials; the general principles for measurement and detecting unusual consumption are based on EPA WaterSense. The documentation for each installation specifies detailed tasks, settings and service intervals.
How are TIXE technologies developed? From research to the car wash.
Behind every new solution are questions about water, energy and day-to-day site operation. Explore the project with Lublin University of Technology, an example of flow research and the journey from idea to application.
TIXE production facilities — from a solution to finished equipment.
2021–2023project period1 January 2021 – 30 June 2023, according to the Lublin University of Technology project record.
4geometries studiedThe number of orifice variants compared in the 2022 cavitation publication.
2pressure valuesTwo inlet pressure conditions considered in this simulation.
What this guide covers
A university, simulations, production facilities and an equipment demonstration. See what each stage contributes to development.
The starting point is a problem encountered in daily operation.
A car wash owner sees bills, wash quality and the time spent on maintenance. A designer turns those observations into questions: where is water consumed, how does the drive operate, what happens to heat and how does the system behave in winter? A well-defined question sets the scope of the work.
01
Water
Which water stream can be reused, and what treatment does it require?
02
Energy
How can system operation be matched to the wash programme and actual demand?
03
Operation
How can components remain accessible, parameters be monitored and maintenance be planned?
These are also useful questions for an investor. When discussing technology, ask how each piece of equipment addresses a specific need. This makes it easier to assess whether the proposed configuration suits the planned site and the resources available to maintain it.
The project that brought a university and a manufacturer together.
In November 2020, NCBR described a self-service car wash project with a compact system for saving and recovering water and energy. The named partners were Lublin University of Technology and Tixewash Polska Danuta Alchimowicz Spółka Jawna.
2020 · project selectionNCBR announces the undertaking in the “Application Projects” competition.
2021 · startThe start of the implementation period stated in the university's project record.
2022 · publicationA simulation study of cavitation funded by this project is published.
2023 · end of the period30 June — the end date given by Lublin University of Technology.
The project record POIR.04.01.04-00-0057/20 describes work on wastewater treatment, drive control and frost protection for floors, pipes and lances. This reflects a broad view of the car wash as a set of interacting systems.
Interesting insight: the shape of an orifice changes how the phenomenon develops.
In 2022, Konrad Pietrykowski and Paweł Karpiński described a computational analysis of hydrodynamic cavitation. In this phenomenon, local flow conditions cause gas-phase regions to form. The authors studied water flow through orifices with different geometries using a two-dimensional CFD model.
01
What was varied?
Four orifice geometries and two inlet pressure values.
02
What was observed?
Velocity and pressure distributions, and the gas-phase fraction in the flow being analysed.
03
What was interesting?
The geometry producing the largest cavitation region was not the one that produced the largest gas-phase fraction per unit of power.
The university's publication database states that the work was funded by project POIR.04.01.04-00-0057/20. The study shows why component shape and flow conditions are analysed during equipment development. It concerns a specific model; it is neither a measurement of an entire car wash nor an operating report on CYCLO-BOOSTER.
From a model to equipment that can be operated and maintained.
TIXE facilities — assembly of technology components.
Putting an idea into practice at a site involves further decisions: component selection, connection layout, service access, controls and installation requirements. The operator should know how to monitor the system and which tasks to perform at agreed intervals.
The TIXE website presents our in-house design, production and service facilities. This is where modules are prepared and their workmanship is checked. For investors, key outcomes of this work are a clear scope of supply and the documentation needed for the next stages of the project.
Stage
What should you ask?
Selection
What water quality, number of bays and wash programmes is the system designed for?
Integration
What space, connections and changes to the existing installation will be needed?
Operation
How can operation be monitored, servicing planned and performance measured?
These questions help connect research insights with comparing the scope of proposals. For an upgrade, the documentation and condition of the current equipment provide an additional reference point.
Trade shows showcase the equipment. The site determines its application.
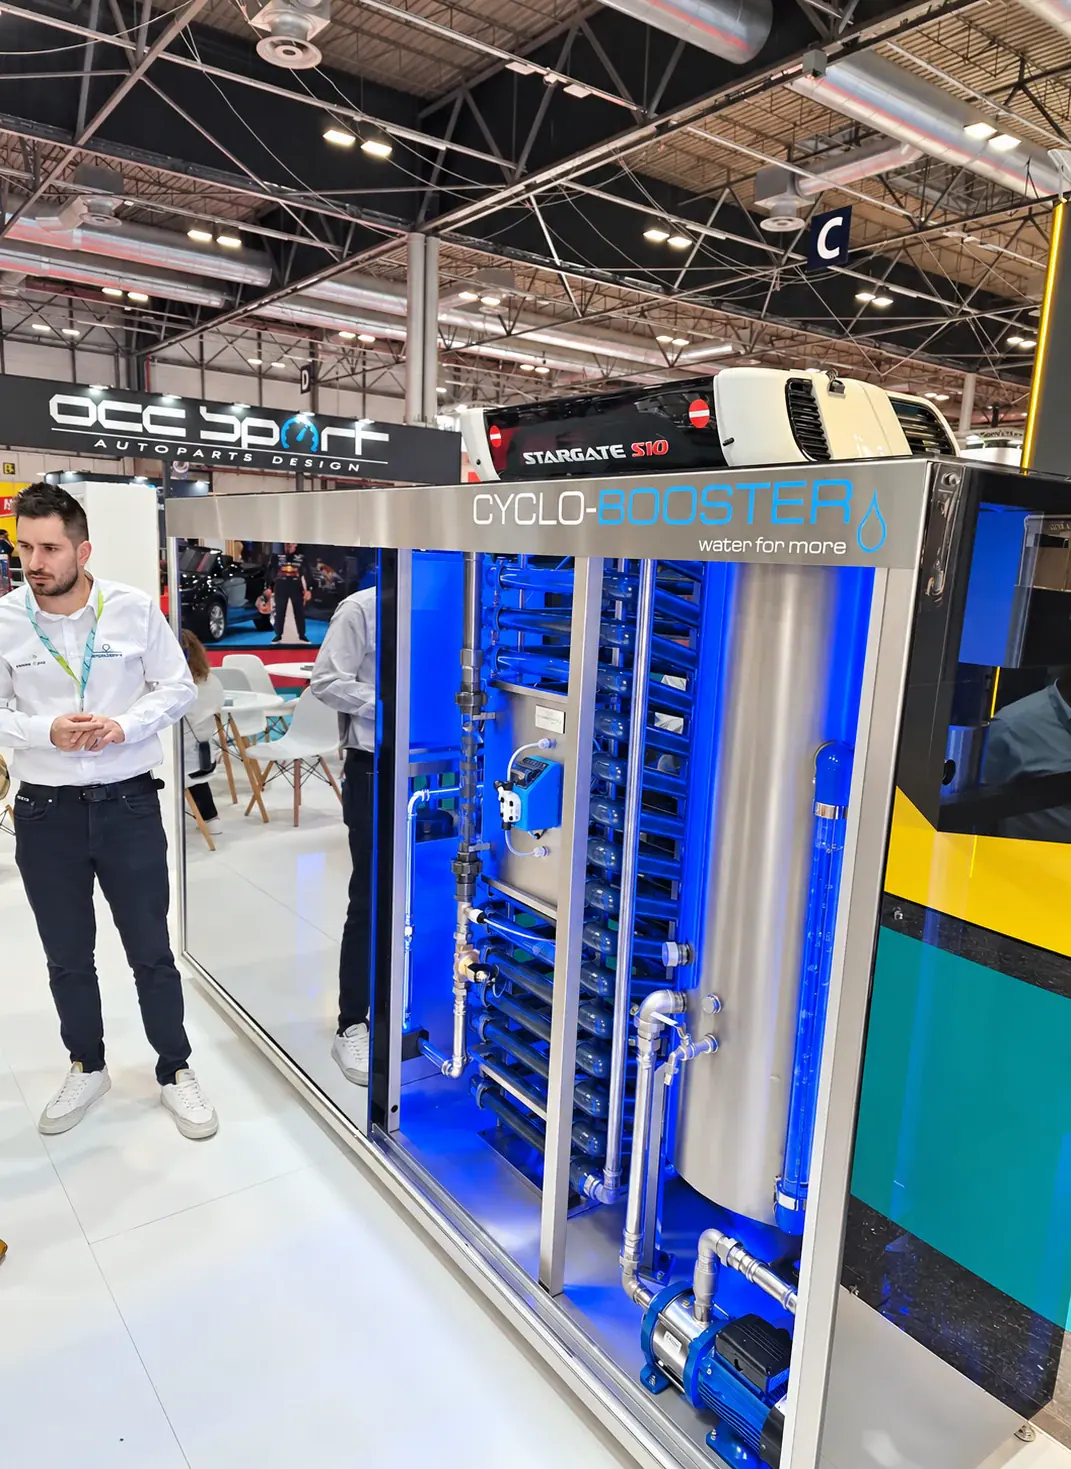
CYCLO-BOOSTER during its presentation at Motortec in Madrid · photo from TIXE materials.
TIXE materials show the presentation of CYCLO-BOOSTER at the Motortec trade show in Madrid. Seeing the equipment makes it easier to discuss its design and future application. Event photos document the presentation; technical documentation specifies operating parameters.
CYCLO-BOOSTER is currently presented on our website as a completed project being prepared for implementation. Before including the solution in a specific investment, we establish availability, scope of supply, integration conditions and subsequent maintenance arrangements.
Research, product documentation and site observations complement one another. This approach makes technology decisions easier and provides specific data to refer back to during operation. Read more about the water circuits in the car wash water guide.
FAQ
Frequently asked questions
Which university collaborated on the project described?
Lublin University of Technology. NCBR identifies it and Tixewash Polska as partners in the project concerning water and energy savings and recovery.
Does the cavitation publication describe the performance of an entire car wash?
It describes a computational analysis of specific flow geometries. It is an example of scientific work funded by the project; it is not a measurement report for a complete car wash.
Where can I check the current status of the technology?
On the TIXE technology page and in discussions about a specific project. Before an order is placed, we establish availability, configuration, requirements and scope of work.
Sources and materials
Prepared using the cited NCBR and Lublin University of Technology sources and TIXE's own materials. Project targets, simulation results and current equipment specifications cover different types of information.
Our guides cover the construction, technology and operation of touchless car washes. Choose a topic to help you make the next decisions about your investment or existing site.
Express offers more configuration options and scope for planning future expansion. Rapid helps make efficient use of smaller sites and a fixed number of bays.
TixExpress
Up to 6 bays per technical container. More space for technology, wider bays and configuration flexibility — designed for intensive use and future expansion.
Up to 6 bays / technical container
Expansion plan
New technologies
What does Express offer? +
Configuration flexibility
A larger technical container provides room for an extensive range of systems, programmes and equipment. We tailor the layout to the site's functions and conditions.
Growth planned from the outset
One technical container serves up to 6 bays. We include further bay expansion, the container layout and new services in the car wash's long-term concept.
Ready for upgrades
We reserve space for future technology, additional systems and solutions such as reactive power compensation. The level of preparation depends on the chosen configuration.
Durability under intensive use
Quality components and convenient service access support uptime and help the site realise its revenue potential for years to come.
TixeRapid
Up to 3 bays, a compact technical container and a lower initial investment. For smaller sites, petrol stations and local markets — with TIXE wash quality and durability.
Up to 3 bays
Space savings
Technology in a technical container
What does Rapid offer? +
Comfortable washing space
The technical container remains outside the bays' working area. Drivers can use the car wash without restrictions caused by protruding technology modules.
Technical facilities in one place
The heated interior protects components from frost and provides the access needed for operation and servicing. The compact layout also allows for equipment upgrades.
Investment matched to the location
A smaller technical container reduces the space required and helps optimise investment costs. We match programmes, payments and equipment to local market needs.
A defined number of bays
Rapid serves a maximum of 3 bays, with no expansion beyond this number. Technology upgrades at this scale are discussed for each specific configuration.
Give your car wash its own character
Car wash enclosures. Choose your style.
Choose a style that suits your location and brand. We will combine the enclosure with the technology line and planned bay layout.
SIMPLE
A clean form that brings order to the washing area. For projects where a clear layout and timeless appearance matter.
Behind the enclosure's appearance are a steel structure, materials chosen for car wash conditions and LED lighting.
Steel structure+
We hot-dip galvanise closed profiles inside and out. This treatment helps the structure resist corrosion in everyday car wash operation.
Panels and finish+
The panels consist of two outer layers of coated aluminium and a polyethylene core. We select the material for durability, appearance and resistance to weather, chemicals and mechanical damage.
Roof covering+
For single-pitch roofs, we use trapezoidal sheet metal galvanised and painted on both sides. Arched roofing is made from translucent trapezoidal fibreglass-reinforced polyester; its colour can be matched to the project.
Lighting and bay partitions+
We use LED technology to illuminate bays and advertising elements. Partitions made from three-layer block-out material have two white printable layers and a black core that reduces light and graphic show-through between the two sides.
Technology and wash programmes
Technology and wash programmes.
From pre-foam and the main wash to waxing and the final rinse. We match the washing system, water preparation and water use to your car wash programmes.
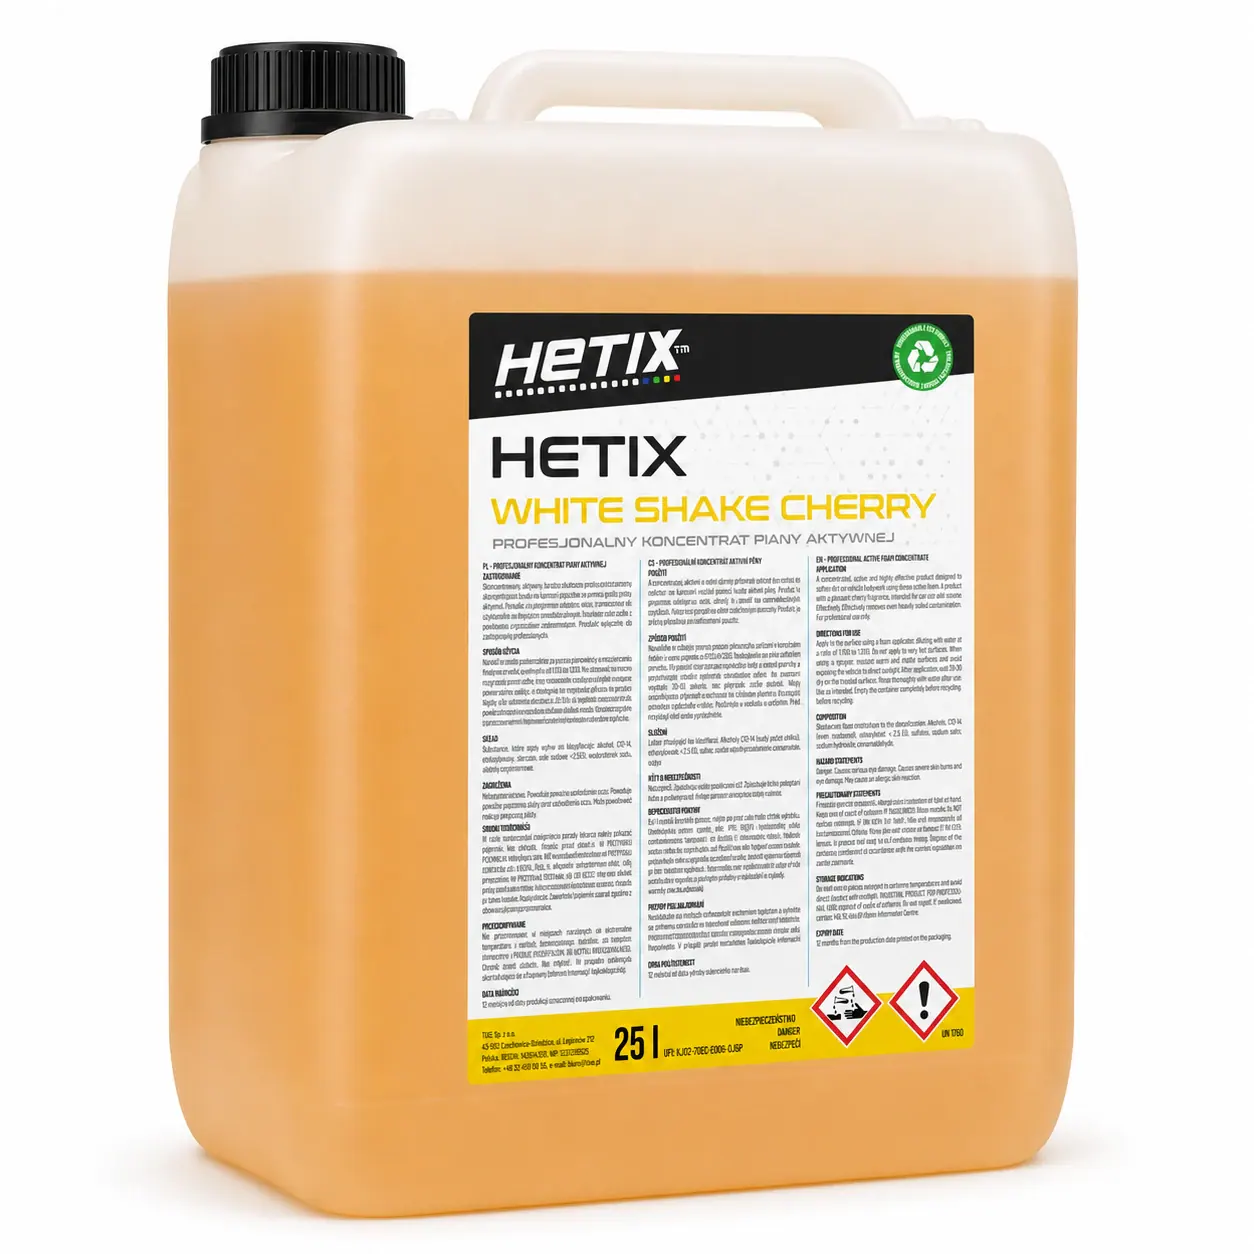
Foams, wash products and waxes for each stage of vehicle care. Explore HETIX chemicals and choose products suited to your car wash programmes and technology.
Technical support, parts and maintenance planning help you care for your car wash every day. Find out how to contact the service team and prepare a request.
Recipient: biuro@tixe.pl. Nothing has been sent yet.
Innovation in every drop
Technologies for touchless car washes.
Our proprietary touchless car wash technologies address water, energy, wash quality and site operation needs. Explore how individual systems work, then discuss the complete configuration with us.
Swipe through the topics or use the arrows.
TIXE technologies
Water and energy
Solutions for water recovery, preparation and heating. Selection takes account of the installation and how the site operates.
6 systems · swipe to see more
CYCLO-BOOSTER
A system for recovering water from process wastewater. The project is complete and being prepared for implementation.
A system designed to reduce water and energy consumption and the load on key components.
Explore its applications +
Less water and energy in every wash cycle. MULTI-BAR DRAGON is a system developed by TIXE's R&D department that combines resource savings with care for equipment durability.
The system optimises washing system operation and component loads. The benefits include both utility consumption and operating conditions for pumps, motors, solenoid valve diaphragms and pressure regulators — components essential to car wash uptime.
Reduced water intake and process wastewater volume.
Lower electrical energy demand from the washing system.
Reduced loads on key components during day-to-day operation.
TIXE data indicates a 30% reduction in water consumption and wastewater volume, and a 50% reduction in electricity consumption within the washing system. We discuss the baseline and comparison conditions when selecting the configuration; these figures do not mean that all site costs fall by the stated percentages.
Collects reverse osmosis reject water so it can be used, for example, to clean the site.
Explore its applications +
Water from reverse osmosis production can still be put to work. AQUARIUS collects reject water and directs it for reuse, for example for cleaning the car wash.
Reverse osmosis produces water for the final vehicle rinse and a reject stream. AQUARIUS uses a tank and pumping system to put the latter stream to use in selected applications. This recovers water from the treatment process; CYCLO-BOOSTER handles process wastewater after washing.
Collection of reject water from the RO installation.
Storage and pumping to planned water outlets.
Reduced freshwater consumption for cleaning tasks.
Boosts and stabilises the water supply pressure when connection parameters fluctuate.
Explore its applications +
A stable water supply for operating bays. HYDRO FORCE boosts supply pressure when connection parameters temporarily drop.
We match the system to the capacity of the mains or private water source and the car wash's demand. Pressure boosting helps maintain the conditions required by the technology when bays operate simultaneously. The starting point is measurements of the available water source and the site's planned load.
Support during temporary drops in mains pressure.
Suitable for use with a private water source.
Selection based on source capacity and peak bay demand.
Combines filtration, softening and reverse osmosis to prepare water for washing and final rinsing.
Explore its applications +
Wash quality starts with water quality. WATER PERFECT CLEAN prepares water for effective chemical performance and the final vehicle rinse.
The system combines pre-filters, two parallel softening columns, dechlorination through carbon filters and reverse osmosis. High-performance RO membranes supply final-rinse water, reducing mineral residue and drying marks. Water treatment also supports the durability of components in contact with water.
Pre-filtration and water softening for wash programmes.
Chlorine removal through carbon filters.
Reverse osmosis for the final spot-free rinse and compatibility with AQUARIUS.
Programmes and systems supporting effective washing, rinsing and convenient bay use.
2 systems · swipe to see more
DOUBLE POWER
Supports the brush washing system: intensive aeration produces abundant foam and helps remove dirt.
Explore its applications +
Abundant foam in the brush programme. DOUBLE POWER helps remove dirt while reducing water consumption.
DOUBLE POWER adds intensive foam aeration to the brush washing system. The programme can operate without starting the high-pressure pumps. This means fewer pump operating hours and lower energy demand at this stage of the wash.
Brush system: abundant foam with efficient water use.
Brush: intensive foaming to help remove dirt.
Controls and dosing tailored to brush operation.
According to TIXE data: twice the foam production and 50% less water in the brush programme with DOUBLE POWER. Comparison requires matching configurations and operating conditions.
Payment processing and information needed to monitor the car wash. Available functions depend on the configuration.
6 systems · swipe to see more
NetConnect
Statistics and app-based control functions make the car wash easier to manage even when you are off site.
Explore its applications +
Know how your car wash is running, even when you are away. NetConnect provides the data needed for daily monitoring on your smartphone or tablet.
The app shows operating time, sales and revenue statistics broken down by the bays, programmes and devices included in the configuration. This makes it easier to assess service popularity, site utilisation and changes in customer behaviour. The data helps inform decisions about your offering and maintenance arrangements.
View statistics on a smartphone or tablet.
Performance of individual bays, programmes and devices.
Information to support planning your offering and future development.
A choice of cash and cashless payment methods gives drivers a convenient way to pay for a service.
Explore its applications +
Payments to suit your customers. TIXE PAY lets you tailor cash, card and contactless payment options to wash bays and additional equipment.
Depending on the equipment, customers can use coins, tokens, banknotes, payment and loyalty cards, and NFC payments by phone or watch. Selection also covers fiscal recording and terminal connections. We plan the whole system together with the payment operator and equipment configuration.
Cash and tokens in selected devices.
Cards and contactless payments by phone or watch.
Integration of payments, fiscal recording and payment operator services.
Transfers coins and tokens from bay control panels to collection boxes in the technical container, making cash collection easier.
Explore its applications +
Coins from the bays arrive in one place. OCTOPUS transports coins and tokens from wash control panels to steel cash boxes in the technical container.
Vacuum transport moves them through pipes laid beneath the reinforced concrete floor. The selected turbines and pipes with a low-friction Teflon lining help coins flow smoothly. The operator collects the coins in the technical area, simplifying day-to-day cash handling.
Collection of coins and tokens in the technical container.
Transport pipes incorporated into the floor infrastructure.
Can be combined with COIN FLOW for automatic coin changer replenishment.
Directs coins collected in the technical container to the change machine, reducing the need for manual refilling.
Explore its applications +
Coins return to circulation. COIN FLOW automatically replenishes the coin changer with coins collected in the technical container.
Instead of manually carrying collected coins to the coin changer, the operator benefits from continuous circulation. Customers exchange banknotes for coins, and the coins return from the bays to the technical area. The solution reduces the frequency of manual hopper refills and makes servicing easier to organise.
Automatic transfer of coins from cash boxes to the coin changer.
Fewer tasks involved in manually replenishing coins.
A considered layout of equipment, dosing and controls makes daily operation and servicing easier.
Explore its applications +
Technology that is convenient for the operator too. EASY TO USE is a car wash design approach that makes adjustment, day-to-day operation and servicing easier.
Chemical dosing is independent for each bay, programme and cleaning product. We mount pumps on vibration-reducing frames and design systems for efficient assembly and removal. Labelled and numbered cables, a touchscreen, and accessible water outlets and electrical sockets help with everyday work.
Separate chemical dosing for bays and programmes.
Access to equipment for inspections and upgrades.
An organised electrical installation and intuitive controls.
Loyalty cards help develop offers for regular customers and fleets, with terms tailored to the car wash.
Explore its applications +
A reason to return to your car wash. TIXE CARD supports regular customers and fleet services.
Cards can carry the standard TIXE design or the branding of a specific car wash. Suitably equipped coin changers can issue and top them up. We tailor individual discounts and fleet customer billing to the system configuration and loyalty programme rules.
Cards with standard or custom artwork.
Issuing and top-ups through a suitably equipped coin changer.
Discounts and billing for regular customers and fleets.
Preparation for changing conditions, protection systems and factory-made components.
6 systems · swipe to see more
IHS
Sensors in the floor allow heating to be adjusted to bay temperature.
Explore its applications +
Heating that responds to bay temperature. IHS reads data from sensors positioned directly in the floor.
The controller operates solenoid valves in the glycol circuit that heats the slab. Measuring temperature in the floor allows heating to respond to its actual conditions instead of relying solely on air temperature. This provides more precise heating control in winter.
Temperature sensors integrated into the floor.
Glycol flow controlled by solenoid valves.
Reduced unnecessary heating and support for bay frost protection.
Automatically controls freeze protection for the wash system at low temperatures.
Explore its applications +
Automatic frost protection for the washing system. ANTI-FREEZE supports winter car wash operation without adding a separate set of frost-protection pumps and filters to the technical facilities.
The system uses the controls built into TIXE technology. Fewer additional components simplify maintenance and seasonal preparation. ANTI-FREEZE protects the washing system, while IHS controls floor heating — we select both solutions to suit local conditions.
Automatic control of washing system protection.
A solution integrated with TIXE technology.
Winter preparation covering equipment, settings and site maintenance.
Protective measures support the installation during brief interruptions to the water or power supply.
Explore its applications +
Protection planned alongside the technology. TECH SECURITY helps protect equipment during temporary interruptions to water and power supplies.
The system includes power supply protection, restart when suitable conditions return, equipment earthing and active ventilation of the electrical cabinet. Water supply monitoring reduces the risk of high-pressure pumps running under unsuitable conditions, while ventilation helps remove heat during intensive operation.
System response to temporary power or water loss.
Earthing of equipment and installations.
Active electrical cabinet ventilation and controlled restart.
We assemble and test the equipment at the TIXE factory. The completed technical container is delivered to the project site.
Explore its applications +
Technical facilities designed for car wash technology. The prefabricated TIXE technical container is built to accommodate the weight of tanks, boilers and other equipment.
The floor combines Cetris structural cement board with chequered stainless steel. PIR sandwich panels provide insulation, while the frame is protected by four coating layers. Reinforced doors, stainless steel canopies and ventilation grilles complete the structure. We install the equipment at the factory, then transport the fitted technical container to the site and position it by crane.
Prepared service openings for water, drainage, heating, coins and electrical installations.
Service space and ventilation matched to the equipment layout.
Technical container size matched to the Rapid or Express line and the planned equipment.
We prepare structural components at the factory and assemble them on site to the design for your car wash.
Explore its applications +
Precision prepared at the factory. We calculate the car wash structure for the project location, taking snow and wind loads into account.
Steel components are produced from fabrication drawings, then cut, welded and hot-dip galvanised at the factory. On site, we assemble the prepared components using a crane and bolted connections. Eliminating on-site welding makes the work easier to organise and shortens structural assembly.
Structural calculations matched to local conditions.
Heating, sensors and service routes incorporated into a single system of prefabricated slabs.
Explore its applications +
A floor with services planned from the start. TIXE prefabricated slabs combine the bay surface with the infrastructure needed to operate the car wash.
The slabs include thermal insulation, heating with temperature sensors, and channels and openings for services. Connections are matched to the technical container, panels, lances and brushes. Slabs, beams and strip foundations form a system joined with a flexible bonding material. Components arrive from the factory and are installed by crane, reducing the amount of flooring work required on site.
Concrete with basalt-granite aggregate, compacted under factory conditions; TIXE declares F150 and W8 classes.
Service space beneath the slabs facilitates access during upgrades.
A demountable system: relocation requires assessment of the new site and design.
A clear list of TIXE programmes. Expand a programme to see what it is used for.
Bodywork 07 programmes
01Wheel and insect pre-sprayAn active alkaline product helps remove dirt before the main wash.
An active alkaline product helps remove dirt before the main wash. The programme uses a dedicated lance and an independent pumping and piping system selected for use with this chemical.
A separate circuit allows components and dosing to be matched to this demanding cleaning product.
02Active foamA dedicated lance covers the bodywork in foam that softens dirt before the main wash.
A dedicated lance covers the bodywork in foam that softens dirt before the main wash. The foaming system is designed for even application and convenient bay use.
03Main washHot, softened water with detergent is delivered at high pressure through the lance….
Hot, softened water with detergent is delivered at high pressure through the main lance. Independent dosing allows the chemical quantity to be set precisely for each programme and bay.
The system can be combined with TOP GUN, with parameters selected to balance wash quality and operating costs.
04XXL brush washA natural-bristle brush helps remove more stubborn dirt.
A natural-bristle brush helps remove more stubborn dirt. The shaped handle and bumpers make the tool comfortable to guide, while the aeration system increases the amount of foam.
The programme uses hot, softened water with detergent. The brush system can be combined with DOUBLE POWER for increased foaming.
05RinseCold, softened water delivered through the main lance removes detergent residue and….
Cold, softened water delivered through the main lance removes detergent residue and dirt. Pressure and flow are selected for effective rinsing with efficient water use.
06WaxPolymer wax applied with softened water forms a protective layer on the paintwork.
Polymer wax applied with softened water forms a protective layer on the paintwork. The lower pressure used in this programme helps the product settle on the surface and allows its consumption to be controlled.
07Spot-free rinseA final rinse with reverse osmosis water reduces mineral deposits and drying marks on the vehicle.
A final rinse with reverse osmosis water reduces mineral deposits and drying marks on the vehicle. RO membranes prepare the water, while the controls adjust flow and pressure for this stage.
01Underbody washHot, softened water with detergent is delivered at high pressure.
Hot, softened water with detergent is delivered at high pressure. Nozzles pointing in different directions help cover more of the underbody, while the trolley and shaped handle make it easier to guide the lance beneath the vehicle.
02Underbody protectionA dedicated ceramic wax is applied with hot, softened water using a trolley-mounted lance.
A dedicated ceramic wax is applied with hot, softened water using a trolley-mounted lance. The programme adds a surface protection stage to underbody washing.
Water recovery and reuse are among the areas in which we develop TIXE technology. CYCLO-BOOSTER was created to treat process wastewater and prepare recovered water for further use at the car wash. The system was developed under TIXECO through collaboration between TIXE engineers and researchers from the Faculty of Mechanical Engineering at Lublin University of Technology.
Project completed · preparing for implementation
Research foundations. From 2021–2023, Tixewash Polska and Lublin University of Technology carried out a project for water and energy recovery and savings, co-funded through an NCBR competition.
CYCLO-BOOSTER
80%
average process wastewater recovery for reuse
TIXE data. Results depend on the car wash configuration and operating conditions.
From project to application
Project complete. Next step: implementation.
We have completed work on the CYCLO-BOOSTER project. We are preparing the technology for implementation in the near future as part of a carefully planned approach to car wash water management.
Its purpose is to reduce demand for fresh water by reusing water that has already been through the washing process. We tailor its integration to each site's installation and technology.
01
Recovery
Water from process wastewater.
02
Treatment
Preparation for reuse.
03
Reuse
Water returned to the washing process.
Launch · Motortec 2025
CYCLO-BOOSTER in Madrid.
The system's debut at Motortec 2025 — the automotive industry trade show at IFEMA MADRID. We presented the water recovery technology and its role in car wash development.
23–26 April 2025 · Madrid, Spain
3 photos · swipe to see more
01 A closer look at the system02 Motortec · IFEMA MADRID03 Trade show display
Our experience in the self-service car wash industry dates back to 2006. We are a Polish-owned company — we design and manufacture car washes and support their owners in day-to-day operation.
This is where TIXE is made.Legionów 212 · Czechowice-Dziedzice
Experience since
2006
Technology present in
6countries
Our technology serves
10 million+vehicles per year
People and place
Every department. One address.
In 2023, we brought all departments together at our new headquarters. Designers, engineers, production, warehouse and service teams work closely together — on the same project and to shared agreements.
For you, this means named contacts, efficient information flow and facilities that remain available after your car wash opens.
Office and team · from project requirements to documentation.
In-house production
Car wash production and quality control.
We prepare components and structures at our factory. Prefabrication allows us to check workmanship before delivery and streamlines assembly on site.
TIXE production hall · preparation of modules and equipment.
A shared standard
Teams work to defined assembly diagrams and procedures.
Checks at every stage
We check components, leak-tightness, pressure and the operation of hydraulic and electrical systems.
Attention to detail
We also verify the quality of the finish and access to components for future servicing.
Technology refined from design through to assembly.
Research and development
Research and development of car wash technology.
Our R&D department develops systems with wash performance, durability and resource consumption in mind. We combine engineering work with our experience as a car wash manufacturer and operator.
DRAGON, IHS and CYCLO-BOOSTER address specific needs: washing, heating and water reuse. We also work with technical universities on technology development.
Responsible manufacturing. We hold a Cleaner Production Certificate. We develop solutions that reduce water and energy consumption, as well as HETIX chemicals.
Warehouse, logistics and service
Support that stays with you.
The warehouse works with production and service teams. We prepare components, parts and chemicals for new projects and for servicing operating car washes.
After commissioning, we help with inspections, repairs and equipment development. You know the right department and who to contact when the next issue arises.
Warehouse and logistics · shared facilities for production and service.
Our journey
We have been growing since 2006.
We started as Tixewash Polska. Since 2025, we have operated as TIXE Sp. z o.o. Our experience includes successive completed projects, a modern production plant and research projects.
Our own facilities.Current headquarters · Czechowice-DziedziceOur own technology.Launch · Motortec 2025
We begin operating in the self-service and touchless car wash sector. This marks the start of our experience in the industry.
2010
Tixewash Polska and in-house production
Tixewash Polska is established. We begin manufacturing car washes in Poland under the Tixewash and Tixexpress brands.
2012
Our first car wash abroad
We open our first car wash outside Poland. This is another step in the development of our business.
2014
A self-service car wash centre
We develop the concept of a self-service car wash centre. Complementary equipment expands the range of services available at the car wash.
2015
Prefabricated flooring
We introduce prefabricated flooring in our car wash projects.
2016
Savings and new payment methods
We introduce resource-saving systems alongside contactless and NFC payments.
2017
Our first 100 car washes
We sell our first 100 car washes manufactured in Poland.
2020
The start of the TIXECO project
We begin work on the TIXECO car wash with resource-saving systems and water recycling. The joint project with Lublin University of Technology is selected for funding in the NCBR “Projekty aplikacyjne” programme.
TIXE service covers inspections, fault reports and the selection of consumable parts for car washes. Contact our team to establish the scope of support for your site.
Choose an inspection, warranty repair or out-of-warranty repair for your TIXE car wash. Prepare basic information about the site and symptoms to help us handle your request.
Car wash inspection
Agree the scope of work and a convenient date with the service team.
HETIX chemicals include products for washing and caring for vehicles at car washes. Choose an application and explore products suited to your selected wash programme.
Choose an application.
Concentrated formula
Effective washing. Controlled consumption.
HETIX liquid products for wash programmes, vehicle care and day-to-day site maintenance. Choosing the right product and dosage helps achieve good results while keeping chemical consumption under control.
Pre-spray for wheels, wheel arches and insect residue.
Explore the product +
A concentrated product for wheels and wheel arches and for removing insects from bodywork. Dissolves grease, oils, fats, brake dust deposits and mud. Designed for self-service car washes; suitable for steel and aluminium.
A concentrated alkaline product for pre-softening dirt on bodywork. The active foam helps prepare heavily soiled surfaces for subsequent washing stages at a self-service car wash.
A concentrated product that softens dirt with thick active foam. Designed for self-service car washes, including heavily soiled surfaces. A cherry fragrance enhances the washing experience.
A product for the main vehicle wash at self-service car washes. Softens dirt and removes everyday road grime while helping protect delicate vehicle parts from corrosion.
A concentrated main-wash product. Softens dirt, removes everyday road grime and helps protect delicate vehicle parts from corrosion. A cherry-scented variant for professional use only.
Brush washing, abundant foam and a coffee fragrance.
Explore the product +
A concentrated brush-wash product with enhanced foaming. Dissolves dirt deposited on the vehicle, while its coffee fragrance gives the wash programme a distinctive character.
A concentrated product for brush washing at self-service car washes. Enhanced foaming helps dissolve dirt on bodywork. A variant with a pleasant cherry fragrance.
A concentrated hydrowax that adds shine to paintwork, plastic and rubber components. Helps drying and protects paintwork from weather effects. A citrus-scented variant.
A concentrated hydrowax for paintwork, plastic and rubber components. Adds shine, assists drying and helps protect against weather effects. A eucalyptus-scented variant.
A product based on the fluoropolymer PTFE, for paintwork, plastic and rubber components. Forms a coating that reduces dirt build-up, assists drying and helps protect against weather effects.
Upholstery cleaning concentrate for dedicated equipment.
Explore the product +
A vehicle interior cleaning product for dispensing and extraction cleaning equipment at car washes. Helps remove stubborn stains and ingrained dirt, restoring a fresh appearance to upholstery.
Streak-free cleaning for windows, headlights and non-porous surfaces.
Explore the product +
A product for windows, headlight lenses and other non-porous surfaces, designed for dedicated dispensers. Removes road grime, mud, salt and insect residue without leaving streaks.
A product for cleaning and conditioning tyres, used in dedicated dispensing equipment at car washes. Restores a fresh appearance to rubber and conceals minor scuffs and discolouration.
A product for cleaning and conditioning plastics, designed for dedicated dispensing equipment. Refreshes the surface appearance and conceals minor scratches and discolouration.
A professional fragrance formulated for use in car wash dispensers. Freshens the interior, eliminates unpleasant odours and provides lasting freshness.
For washing and spraying windows and headlights in summer conditions. Formulated for professional car wash dispensers. Removes dust, insects, road grime and everyday deposits.
For washing and spraying windows and headlights in winter conditions. Formulated for professional car wash dispensers. Removes mud, salt, road grime and everyday deposits.
An acidic cleaner for deposits on surfaces resistant to strong acids.
Explore the product +
A concentrate for chemically cleaning deposits produced during car wash operation. Helps remove wax, powder and other chemical mixture residues, as well as limescale and rust streaks.
For washable surfaces resistant to water and strong acids. Before use, check material compatibility against the product recommendations.
Start with the wash programme, dispensing equipment and type of dirt. Tell us your car wash configuration — we will help you select a product and settings that follow its recommendations.
Is every product suitable for every surface? +
Each product has a defined use. Before use, check the label and product sheet, including the recommended concentration and compatibility with the material being cleaned. Restrictions for SKIN and ULTRA CLEANER also appear in their descriptions.
How do I order HETIX chemicals? +
Select “Ask about the product” beside the product you are interested in. Its name will be added to your enquiry. Include your car wash location and required quantity, and we will agree a proposal and delivery.
Choose chemicals for your car wash.
We help you match products to programmes and equipment.
A site for a car wash. What should you check before buying?
A suitable site combines access, development potential, utilities and a practical layout. See how to move from a map to a list of specific points to establish.
TIXE: we assess the land together with vehicle circulation and space for site maintenance.
6assessment areasFrom site identification to the scope of costs.
2approach directionsDrive the actual route from both directions on the road.
1shared base planBays, utilities and traffic on the same plan.
What this guide covers
Assess the site in six areas: land identification, planning, access, utilities, car wash layout and the scope of costs. Gather confirmations and list unknowns before deciding to buy or lease.
Where should I start when assessing a site?
Establish the full plot identifier, cadastral district and municipality. A plot number alone can recur in different locations. Geoportal shows the location and available land register data, while images show the surroundings. Record the map source and download date.
Next, establish the exact area included in the proposed purchase or lease. Mark existing buildings, ditches, trees, slopes and areas needed for access. If use of part of the land requires a separate agreement, show this on the map from the outset.
How do I check planning and access?
Check the current planning documents for the site with the municipality. The designer should assess the proposed use against those provisions and identify further documents and approvals. Where no local development plan exists, establish the appropriate route for this location. Proximity to other services does not establish that a car wash can be built.
01
Permitted use
What do the current provisions say about the site? What restrictions affect buildings, site development and neighbouring areas?
02
Road access
How will access and entry be provided? What conditions need to be agreed with the road authority and included in the design?
03
Customer convenience
Can drivers see the entrance early enough? What are turning, returning and approaching like during busier periods?
Drive the route from both directions. Note central reservations, turning restrictions, nearby junctions and traffic queues. Record observations separately from formal findings: a convenient existing access route does not automatically confirm the conditions for serving the completed project.
Utilities: what needs confirming?
A utility network beside the site is only the start. Selecting a solution requires supply parameters, connection conditions and a defined scope of work. Gather these for the chosen car wash option and pass them to the people coordinating the project.
Utilities: topics to discuss with the designer and relevant operators
Area
Questions to clarify
Water
What supply parameters are available? What water quality data will be needed to select water preparation equipment?
Energy and heating
What power capacity does the technology option require, and how can it be provided? How does the chosen heat source affect the installations?
Wastewater
What wastewater discharge and treatment method is permitted for the project? What conditions must be met?
Rainwater
How will drainage and water management on the site be handled? Where must equipment or tanks be provided?
For each item, add the contractor, confirmation status, estimated scope and timing. Alternative solutions require separate checks. The absence of one utility network alone does not provide a complete answer on feasibility. Read more about water circuits in the technical guide.
How much space does a car wash really need?
The area in a property listing is not enough to determine the number of bays. Put the car wash footprint, technical container, queuing areas, manoeuvres, additional equipment and maintenance access on one base plan. Site shape and entrance position can give two plots of similar size very different potential.
Bucharest during assembly. Site space must be assessed together with its surroundings, vehicle access and technical facilities.
Also consider a practical scenario: a wash queue, a customer at a vacuum and a materials delivery all arrive at the same time. Can vehicles still pass through and leave the bays, and can staff reach the technical container? It is worth running this check before approving the site development concept.
What should I prepare before speaking to TIXE?
The checklist below organises information before a decision. Tick only the areas for which you have material to discuss. An unticked box identifies a task still to do; it does not automatically disqualify the site.
The assessment should lead to a clear direction: further analysis, a revised option or a search for another site. Use the same checklist when comparing locations. This reveals both their advantages and the cost of resolving the remaining unknowns.
FAQ
Frequently asked questions
Is there one minimum site area?
A single square-metre figure does not determine whether construction is possible. Geometry, bay count, road access, utilities, local restrictions and the operation of the whole site also matter.
Is an online map enough for the design?
It helps identify the site and prepare for a discussion. Design documentation requires appropriate materials, with the scope established by the designer together with a surveyor.
Is it worth assessing the site before buying?
Yes. Assessing access, documents, utilities and an initial layout helps identify tasks and costs that affect the decision at an early stage.
Sources and materials
Prepared by TIXE using GUGiK and GUNB materials. Dimensions in the text come from TIXE's initial assumptions; they do not replace a designer's assessment of the specific site.
Car wash location analysis. How do you assess its potential?
Maps, data and observations should inform decisions. Find out where customers may come from and how to distinguish a favourable setting from an assumption that needs checking.
TIXE materials: we analyse the site layout and its surroundings together.
3layers of analysisData, observations and conclusions to verify.
2access perspectivesThe route to the site and back to the daily journey.
3decision optionsContinue, revise the assumptions or look for another location.
What this guide covers
Combine population and traffic data with actual access routes, nearby services and market observations. Record the source and date of every piece of information. The outcome is an option to develop further and a list of risks to reflect in the budget.
What does a regional analysis cover?
Start with a simple question: who is expected to visit this car wash, and on what occasion? A local resident, someone returning from work and a driver visiting a nearby shop may follow different routes and have different expectations. Draw the realistic catchment area, allowing for junctions, road barriers and available routes.
01
People and daily routes
Look at nearby housing, workplaces and services. Describe how the planned site fits into customers' everyday journeys.
02
Location accessibility
Assess the entrance, visibility and ease of returning to the route. Proximity on a map does not always mean a short or straightforward journey.
03
Available services
Identify which needs the local market already serves and where you can offer customers a specific convenience or additional function.
Regional analysis organises the market case. In parallel, the site, utilities and development potential must be assessed. A location with strong demand may require costly works that change the option's viability.
What data is useful?
Statistics Poland's Local Data Bank helps describe population, housing and changes in the surrounding area for specified territorial units. For each figure, record the area, year and indicator definition. Compare data at the same territorial scale and check the available metadata.
Use data to inform questions rather than replace conclusions
Information
What it helps assess
What it cannot establish on its own
Population and housing
The size of the surrounding community and the direction of change.
How many residents will become car wash customers.
Shops and workplaces
Potential opportunities to visit during everyday journeys.
Whether customers can reach the site conveniently and return to their route.
New developments nearby
The possible future direction of the area's development.
Whether the planned development will be completed on schedule.
On-site observations
Current use of roads and services.
A complete picture of a season or annual sales.
Keep a source sheet. If some data is older, supplement it with observations of current conditions. Put an announced housing development or shop in a separate scenario; do not treat a future development as an existing source of visits.
How do I interpret traffic volumes?
GDDKiA's General Traffic Survey covers traffic parameters on surveyed road sections, including annual average daily traffic. It provides useful background for analysis, but does not measure entries onto the site. Record the year, road section identifier and definition of the measure alongside the figure.
Check the dominant direction of traffic relative to the entrance. Consider turning, making a U-turn and exiting when the road is busy. If most traffic is on the opposite side, verify the actual route to the site.
Do not convert all passing traffic into washes using a fixed, universal percentage. Describe any customer acquisition assumption as a scenario and identify the observations that support it. Only then link it to the financial analysis of the project.
What should I check in the local market?
Your own observations of operating sites help describe the services available: number of bays, equipment, payments, clarity of instructions and access convenience. Record facts visible to customers. Appearance and a queue observed once do not reveal revenue.
TIXE material: assess the site's offering together with its surroundings and how the bays are used.
An example of how to record observations — not measurement results for a specific location
Example observation
Possible interpretation
What to check next
Friday, 16:00–17:00: customers waiting at the bays.
A possible increase in demand after work.
Repeat the observation on another Friday and record the weather and bay availability.
Tuesday, 10:00–11:00: low utilisation.
A quieter time of day or an effect of conditions.
Compare other times and another day with similar weather.
Saturday, 11:00–12:00: the vacuum area is busy.
Additional services may need sufficient space.
Check how long spaces are occupied and how the area affects vehicle circulation.
The times in the table suggest ways to vary observations. Adapt them to daily routes in your area. Record the date, weather, observation period and unusual events. This helps avoid drawing conclusions about the whole market from one visit.
What should the analysis produce?
Finish the analysis with a brief decision sheet: arguments for the location, limitations, unknowns and the next task. Present a baseline option and explain what would need to change to justify a larger or smaller site.
FAQ
Frequently asked questions
Does regional analysis predict profit?
Assessing the surroundings provides assumptions for a model. Financial results still require complete costs, financing terms and sales scenarios for the specific project.
Does the presence of other car washes rule out a location?
It does not settle the question on its own. Available services, demand, access and how the planned site will meet real customer needs must all be assessed.
Can I compare several locations?
Yes. Use the same criteria, data periods and observation methods. For each site, also show the technical conditions and costs that need checking.
Sources and materials
Prepared by TIXE. The example times and situations in the table illustrate an observation method; they are not a study of a particular market or a sales forecast.
Car wash site layout concept. What should be agreed before design?
A well-planned car wash works as a whole: from entry and queuing to wash bays, vacuums and access to the technology. See how to check the layout before moving to the next stage.
TIXE materials: bays, additional services and vehicle circulation need space within one coherent layout.
5stages of a visitEntry, waiting, washing, additional services and exit.
3layers of choiceTechnology, enclosure and equipment.
1current optionThe drawing, specification and quotation should agree.
What this guide covers
Combine car wash functions, vehicle circulation, the technical container and installations on one plan. Follow the customer's and maintenance team's routes. Then agree the scope with the designer and suppliers. TIXE's initial concept provides material for further design work.
What should the concept show?
The concept should explain how the site will operate on the specified land. Show wash bays, the technical container, the additional services area and vehicle circulation. Include access to equipment, materials deliveries and space needed for servicing.
Start with the right base plan. Mark the boundaries of the area under consideration, known utility networks, existing features and restrictions to check. Record which data is confirmed and which is assumed for option comparisons. Anyone viewing the drawing should immediately understand its status.
Attach a short list of assumptions to the concept: vehicle types, number of bays, equipment at opening and any planned direction for expansion. This lets you compare complete solutions, rather than just the appeal of the drawings.
How should I plan the number of bays and traffic flow?
Consider the site's scale alongside local demand and the plot's shape. Every extra bay also needs vehicle access. Check the layout during a quiet period and when several activities happen at once.
1. EntryThe driver identifies the entrance and follows the correct direction of travel.
2. WaitingCars wait in a planned area, leaving vehicle routes and access to other functions clear.
3. WashingEntering and leaving a bay allows neighbouring bays to remain in use.
4. Additional servicesThe customer can move on to vacuuming or bypass this area and head for the exit.
5. ExitReturning to the road does not require crossing areas where equipment is being used.
This is a functional outline that must be adapted to the specific drive-through or non-drive-through layout. The designer assesses the manoeuvring space needed for the intended vehicles. Also analyse staff access and servicing while the rest of the site remains in use.
TIXE material: bay operating space and vehicle routes must be included in a shared concept.
Technology and appearance: what do we choose separately?
These choices are connected, but serve different purposes. At TIXE, Rapid and Express describe the technology and technical-container solution. Enclosure names define the site's architectural form. Additional equipment and payments refine how the car wash is used.
01
Technology and technical container
Match the option to programmes, equipment and operation. Include technical space and the installation requirements of the specific configuration.
02
Canopy style
Define the form, materials and colours. Example TIXE styles include SIMPLE PREMIUM, QUADRA, MODERNA and FUTURA.
03
Equipment
Plan payments, vacuuming and other services. Every device needs operating space, service connections and maintenance access.
The drawing should reflect the current equipment list. If equipment is planned for a second phase, mark the reserved space and agree how the installations will be prepared. The possibility of later installation is confirmed for the selected solution. A useful reference is the comparison of technology and enclosures.
Who is responsible for each stage of the work?
Before passing the concept to the next stage, establish who supplies the data, who checks it and who makes the decision. The role map below structures the discussion. Detailed responsibilities and scopes are set out in the contracts.
Responsibility map to clarify in contracts
Participant
Typical contribution to preparation
What to agree
Investor
Requirements, site materials, selection of designers and organisation of work outside the scope of supply.
The decision-maker, budget and change approval process.
TIXE
The concept and data for the chosen technology option within the agreed scope.
Current specification, site preparation requirements and supply boundaries.
Designer
Assessment of constraints, documentation and coordination of the relevant disciplines.
Documentation scope, list of approvals and information needed from suppliers.
Surveyor
Appropriate surveying materials and measurements within the commissioned scope.
Type of base plan, currency of data and timing of necessary work.
Contractors and operators
Agreed works, connections and information about supply parameters.
Interfaces between works, schedules, acceptance conditions and handover to the next stage.
Describe the interfaces between scopes particularly carefully: equipment foundations, service penetrations, connections and site readiness for assembly. Assign one coordinator to each task. This prevents questions from falling between two contractors.
What can change the concept?
New connection conditions, more precise ground data, road approvals or equipment changes may require components to be moved. Check each change against the layout, specification, scope of work and budget together.
Commercial and design work can run in parallel. Before construction, however, the layout, scopes, schedules and required procedures must be agreed consistently. Once these are established, it is easier to plan assembly and acceptance of successive works.
FAQ
Frequently asked questions
Is the concept a complete construction design?
No. TIXE's initial layout is material for further design and verification for the specified site. The designer prepares the documentation within the appropriate scope.
Can I choose the enclosure's appearance first?
You can establish a visual direction. Coordinate the final choice with technology, vehicle circulation, site restrictions and budget.
Does increasing the number of bays always improve the layout?
It must be assessed alongside demand, queuing space, vehicle routes and additional functions. Fitting a bay footprint onto a drawing alone does not confirm that the whole site will work efficiently.
Sources and materials
Prepared by TIXE. The diagram shows site functions, and the table shows a typical division of topics to agree. They do not replace the design or scopes defined for a specific project.
Expand your offering, improve operation and refresh your car wash's appearance. We will start with the site's condition and the changes that matter most to you.
The left and right arrow keys move the line. Home shows the full car wash after the upgrade; End shows it before the upgrade.
Swipe through the topics or use the arrows.
Wash offering
More options at the bay.
Expand your offering with new programmes. We will match them to your car wash's installation and equipment.
Wheel pre-spray
Active foam
Wash brush
Underbody wash
What makes a TIXE car wash easier to expand?+
We design TIXE car wash floors for a wide range of programmes. Omron-based controls offer scope to extend functions. At an older site, we check the year of manufacture, control version and installation condition to identify a specific scope of changes.
When is it worth replacing the control panel?+
When adding programmes, changing operation or refreshing the bays. Panels with LCD screens can display promotional videos, advertising and messages. We select functions and compatibility for the specific device and controller.
We select improvements to solve the actual issue: finding a free bay, payment methods or the time needed for cash handling.
Bay occupancy indicators+
A traffic light system helps drivers identify an available bay. It works well alongside clear signage and traffic management, especially at sites with several rows of bays.
Contactless payments and fiscal recording+
We can plan card, phone and smartwatch payments and integration with fiscal recording. We check the solution's scope for wash panels and additional equipment, taking installation compatibility into account.
Coin changers and loyalty cards+
A coin changer that issues and tops up cards can make serving regular customers easier. We match promotional rules, fleet offers and billing methods to the car wash's operating model.
Upholstery cleaning, tyre and dashboard product sprays, fragrances, paper dispensers, glass and leather product dispensers, and tyre inflation compressors. We match the service range to the space available in the dry area and the installation's capabilities.
Operation
New technologies at an operating car wash.
The modular design of many TIXE systems allows upgrades to existing sites to be planned. We will assess what can be retained and how new solutions can be integrated with the current installation.
Prepare the location, year and manufacturer of the site, photos of the technical facilities and a list of desired changes. If you are analysing utility consumption, include data from comparable periods.
Site assessmentEquipment condition, documentation and the purpose of the change.
Scope and quotationPriorities, installation compatibility and allocation of work.
Installation and commissioningSchedule, required shutdowns and performance checks.
Rules for using the TIXE website, configurator and contact tools.
Draft · 13 October 2026. A proposal for the current website preview. Before publication, it requires TIXE approval and legal review once the website's final functions have been established.
Service provider and contact
The website is operated by TIXE Sp. z o.o., ul. Legionów 212, 43-502 Czechowice-Dziedzice. KRS: 0001158770, NIP: 1231228525, REGON: 142614350. District Court Katowice-Wschód in Katowice, VIII Commercial Division of the National Court Register. Share capital: 200 000 zł.
Use of the website is free of charge. You can browse our offering, guides, projects and contact details, use the search function, and prepare a car wash configuration and enquiry text.
In the current version, contact forms, investment analysis and the configurator prepare an email message. You send it yourself from your own email account. Completing fields or opening your email app does not send a request to TIXE.
The Partner Area is currently informational. The website does not provide customer accounts, login, a shopping basket or online payments. Purchases of car washes, parts, chemicals and services require separate arrangements with TIXE. A service-related message does not confirm a repair date or acceptance of an order.
Rules of use
To use the website, you need an up-to-date browser supporting HTML, CSS and JavaScript. The online version requires internet access, and sending a prepared message requires email access. Your internet or telephone operator may charge fees under your contract.
The free electronic service begins when you activate the selected function. You can stop using it at any time by closing the page. This does not create any obligation to purchase.
You must not submit unlawful content, infringe other people's rights or take action that disrupts the website. Provide only the information needed to handle your matter; do not send passwords, payment card details or specially protected data.
Materials, configurator and proposals
Descriptions, visualisations, guides and configurator results help you prepare for a discussion. They do not replace an individual design, site assessment or binding proposal. Final scope, availability, price and timing are determined by the arrangements and agreement with TIXE. The budget chart is illustrative.
Photos, text, marks and other materials are legally protected. You may use them within the limits of permitted use; other uses require appropriate authorisation. Rights to external materials belong to their owners.
TIXE makes efforts to ensure information is reliable. Errors and outdated information can be reported to the office email address. External links lead to websites operating under their own rules. These terms do not limit rights arising from mandatory legal provisions.
Technical issues and complaints
Report comments about the website's operation to biuro@tixe.pl or in writing to the registered office. Describe the problem, when it occurred and how we can reply. Browser information or a screenshot may help clarify the issue.
The proposed response time is up to 14 days from receipt, subject to legally required deadlines. Equipment complaints and car wash fault reports are handled by TIXE service under the applicable agreement and warranty terms.
Privacy and updates
Data processing rules are described in the privacy policy. Consent to the optional map is not a condition of using the website's other functions.
Changes to functions or legislation may require an update to these terms. A new version will carry a date and will not retrospectively change the terms of agreements already concluded. The document will be supplemented appropriately when forms that send data directly or a B2B portal are launched.
Data and privacy
Privacy policy.
How we use data provided to TIXE and how you can manage your choices.
Draft · 13 October 2026. This description applies to the current preview. Before publication, hosting and email providers, data retention periods and final form handling must be confirmed.
Data controller
The controller of data provided in correspondence is TIXE Sp. z o.o., ul. Legionów 212, 43-502 Czechowice-Dziedzice, KRS 0001158770, NIP 1231228525. For personal data matters, write to biuro@tixe.pl or to the registered office address.
What data and for what purpose
In the website preview, data entered in forms and the configurator is used to prepare a message in your browser. It is not sent to TIXE automatically. We receive it only when you send an email. We do not store contact form or configurator content in the website's local storage; the browser may independently remember fields according to its own settings. Guide checklists remember ticked items and a note in this browser so that you can return to your preparations. You can delete them using the “Clear” button beside the relevant list or by clearing the website's data. Downloading a summary and opening it in your email app does not send it to TIXE.
Contact and answering enquiries: email address, full name, optional phone number, correspondence content and company details if provided. The legal basis is our legitimate interest in correspondence and handling enquiries — Article 6(1)(f) GDPR.
Preparing proposals and investment analysis: also location, plot number and cadastral district, project stage and selected car wash parameters. When you act on your own behalf before entering into a contract, the basis is Article 6(1)(b) GDPR. When contacting us on behalf of a company, it is Article 6(1)(f) GDPR: the interest in managing the business relationship.
Establishing, exercising or defending legal claims: data relating to the matter, to the extent necessary — Article 6(1)(f) GDPR.
Optional Google map: we enable it on the basis of your consent. You can refuse and still use the address, phone number and the rest of the website.
Providing data is voluntary. Without contact details, we may be unable to reply; without location information, we may be unable to prepare an analysis. A request for contact does not constitute consent to a newsletter or future marketing campaigns.
How long we retain data
Proposal for TIXE approval: we retain correspondence about enquiries that do not result in a contract until the matter is closed, and then for no longer than 12 months after the last contact. If data is needed to establish or defend claims, we retain only what is necessary until the applicable limitation period expires or the proceedings end.
Where a contract is concluded, retention periods follow from its performance and applicable legal obligations; relevant information will be provided when the contract is concluded. We remember your map choice in this browser for 180 days. Clearing website data or changing the version of the choice mechanism may cause the question to appear again.
Data recipients and external services
To the extent necessary to handle correspondence, data may be accessible to authorised TIXE personnel and providers of email, IT and legal services. Public authorities may receive data where required by law. Before publication, we will confirm the actual providers, data processing arrangements and any transfers outside the European Economic Area.
When you enable the map, Google receives connection data, including your IP address and browser information. For users in the EEA, the service is provided by Google Ireland Limited. Google may also process data outside the EEA under the safeguards it describes. Purposes, retention periods and transfer rules are described in Google's privacy policy ↗.
Opening an external link, for example to Google Maps or LinkedIn, takes you to a separate service. That service's provider processes data under its own rules. The local HTML file has no server handling visits. When published online, the infrastructure provider may keep technical logs — their scope and retention must be established before launch.
Your rights
Under the GDPR, you may request access to your data, rectification, erasure, restriction of processing and, where applicable, data portability. You may object to processing based on legitimate interests for reasons relating to your particular situation.
You may withdraw consent at any time without affecting the lawfulness of prior processing. You can change map settings using the button below or in the footer. For matters concerning data provided to TIXE, write to biuro@tixe.pl. You may also lodge a complaint with the President of Poland's Personal Data Protection Office — uodo.gov.pl ↗.
The website's current tools do not make automated decisions with legal effects or profile users for that purpose.
Cookies and privacy settings
The website's own code does not set analytics or advertising cookies. Fonts, images and scripts are supplied with the project. We use one entry to remember your choice: tixe-privacy-v1 in the browser's local storage. It contains the map choice, date, expiry date and settings version; it contains no form content or advertising identifier. Separate guide checklist entries (tixe-checklist-v1) contain ticked items and your own note. They remain in this browser until the relevant list or website data is cleared and are not used for analytics or advertising.
The Google map is disabled by default. After consent, it may use Google technologies, including cookies. Withdrawing consent removes the embedded map and prevents it from loading again. It does not delete data Google has already received or cookies stored on its domains — you manage those through your browser and Google services.
When browser storage is unavailable, your choice applies only in the open tab. Analytics and marketing are not currently connected. Any future activation requires the information to be updated in advance and separate choices to be provided.
Document changes
Before connecting new services, we will update the description of how they work and the data they use. The current document version will be available in the footer. Changing the text alone will not change the scope of consent you have given.
Quick links
Sitemap.
Our offering, knowledge and contact details — choose where you want to go.
TIXE · PRIVACY
You decide about the Google map.
The website does not use advertising or analytics cookies. We will show the directions map on the Contact page only with your consent. Privacy policy.